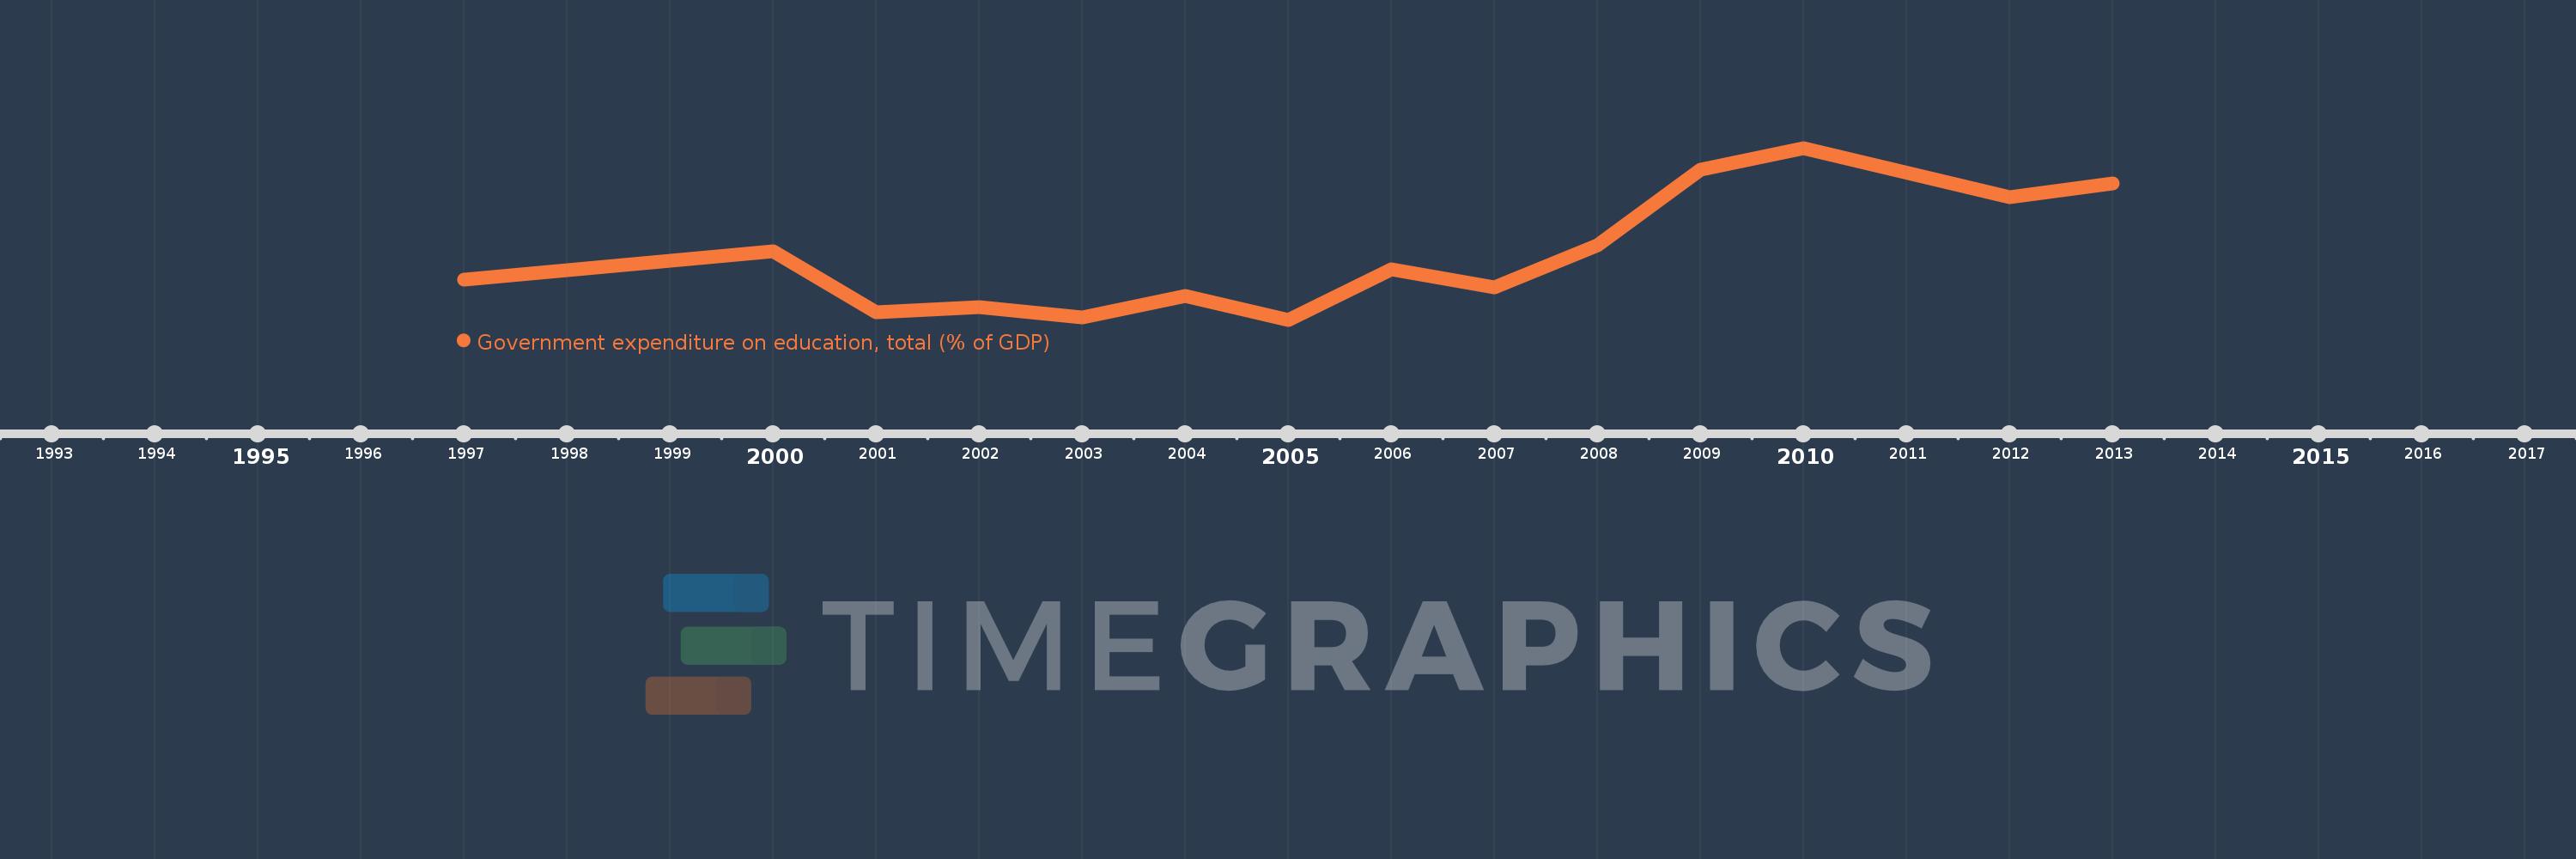
This timeline shows a graph from 1997 to 2013 of Europe & Central Asia (excluding high income). No data until 1996. Number of actual observations by date: 14.
Source name:
World Development Indicators
Source organization:
United Nations Educational, Scientific, and Cultural Organization (UNESCO) Institute for Statistics.
Categories, topics:
Education
Last updated:
apr 23, 2017
Indicators value changes by year
Meaning:
3.59
Minimum:
3.214
jan 1, 2005
Maximum:
4.228
jan 1, 2010
At the date of observation
Value
Absolute change
Change from the previous value
jan 1, 1997
3.451
+3.451
0.0%
jan 1, 2000
3.618
+0.167
4.85%
jan 1, 2001
3.257
-0.361
-9.99%
jan 1, 2002
3.291
+0.034
1.04%
jan 1, 2003
3.227
-0.063
-1.92%
jan 1, 2004
3.354
+0.127
3.93%
jan 1, 2005
3.214
-0.14
-4.16%
jan 1, 2006
3.512
+0.298
9.26%
jan 1, 2007
3.403
-0.109
-3.09%
jan 1, 2008
3.653
+0.249
7.33%
jan 1, 2009
4.102
+0.449
12.29%
jan 1, 2010
4.228
+0.126
3.08%
jan 1, 2012
3.935
-0.293
-6.93%
jan 1, 2013
4.018
+0.083
2.11%
Ranking of countries by current statistics by years