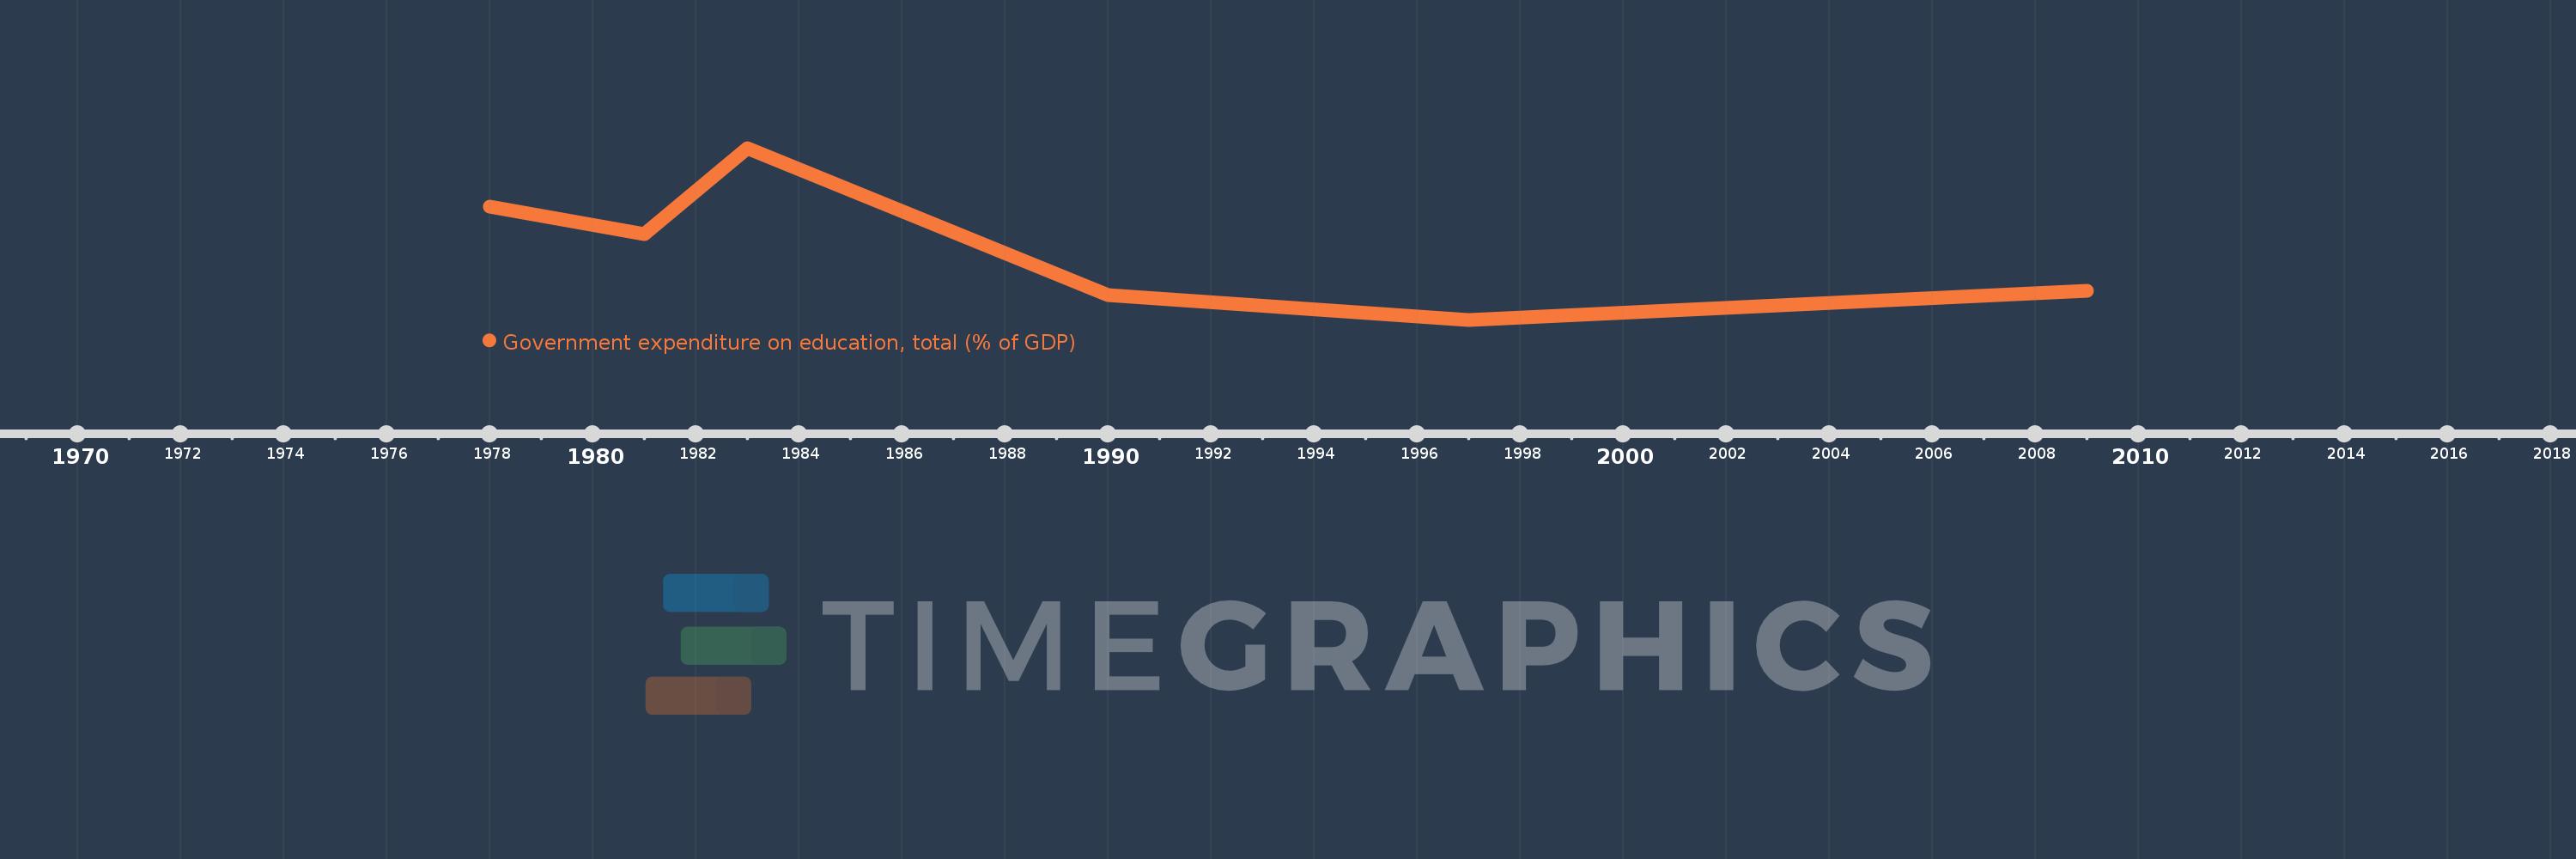
This timeline shows a graph from 1978 to 2009 of Middle East & North Africa (IDA & IBRD countries). No data until 1977. Number of actual observations by date: 6.
Source name:
World Development Indicators
Source organization:
United Nations Educational, Scientific, and Cultural Organization (UNESCO) Institute for Statistics.
Categories, topics:
Education
Last updated:
apr 23, 2017
Indicators value changes by year
Meaning:
4.784
Minimum:
4.214
jan 1, 1997
Maximum:
5.601
jan 1, 1983
At the date of observation
Value
Absolute change
Change from the previous value
jan 1, 1978
5.124
+5.124
0.0%
jan 1, 1981
4.905
-0.219
-4.28%
jan 1, 1983
5.601
+0.696
14.18%
jan 1, 1990
4.41
-1.19
-21.25%
jan 1, 1997
4.214
-0.197
-4.46%
jan 1, 2009
4.449
+0.235
5.58%
Ranking of countries by current statistics by years