33
/
AIzaSyB4mHJ5NPEv-XzF7P6NDYXjlkCWaeKw5bc
November 30, 2025
162592
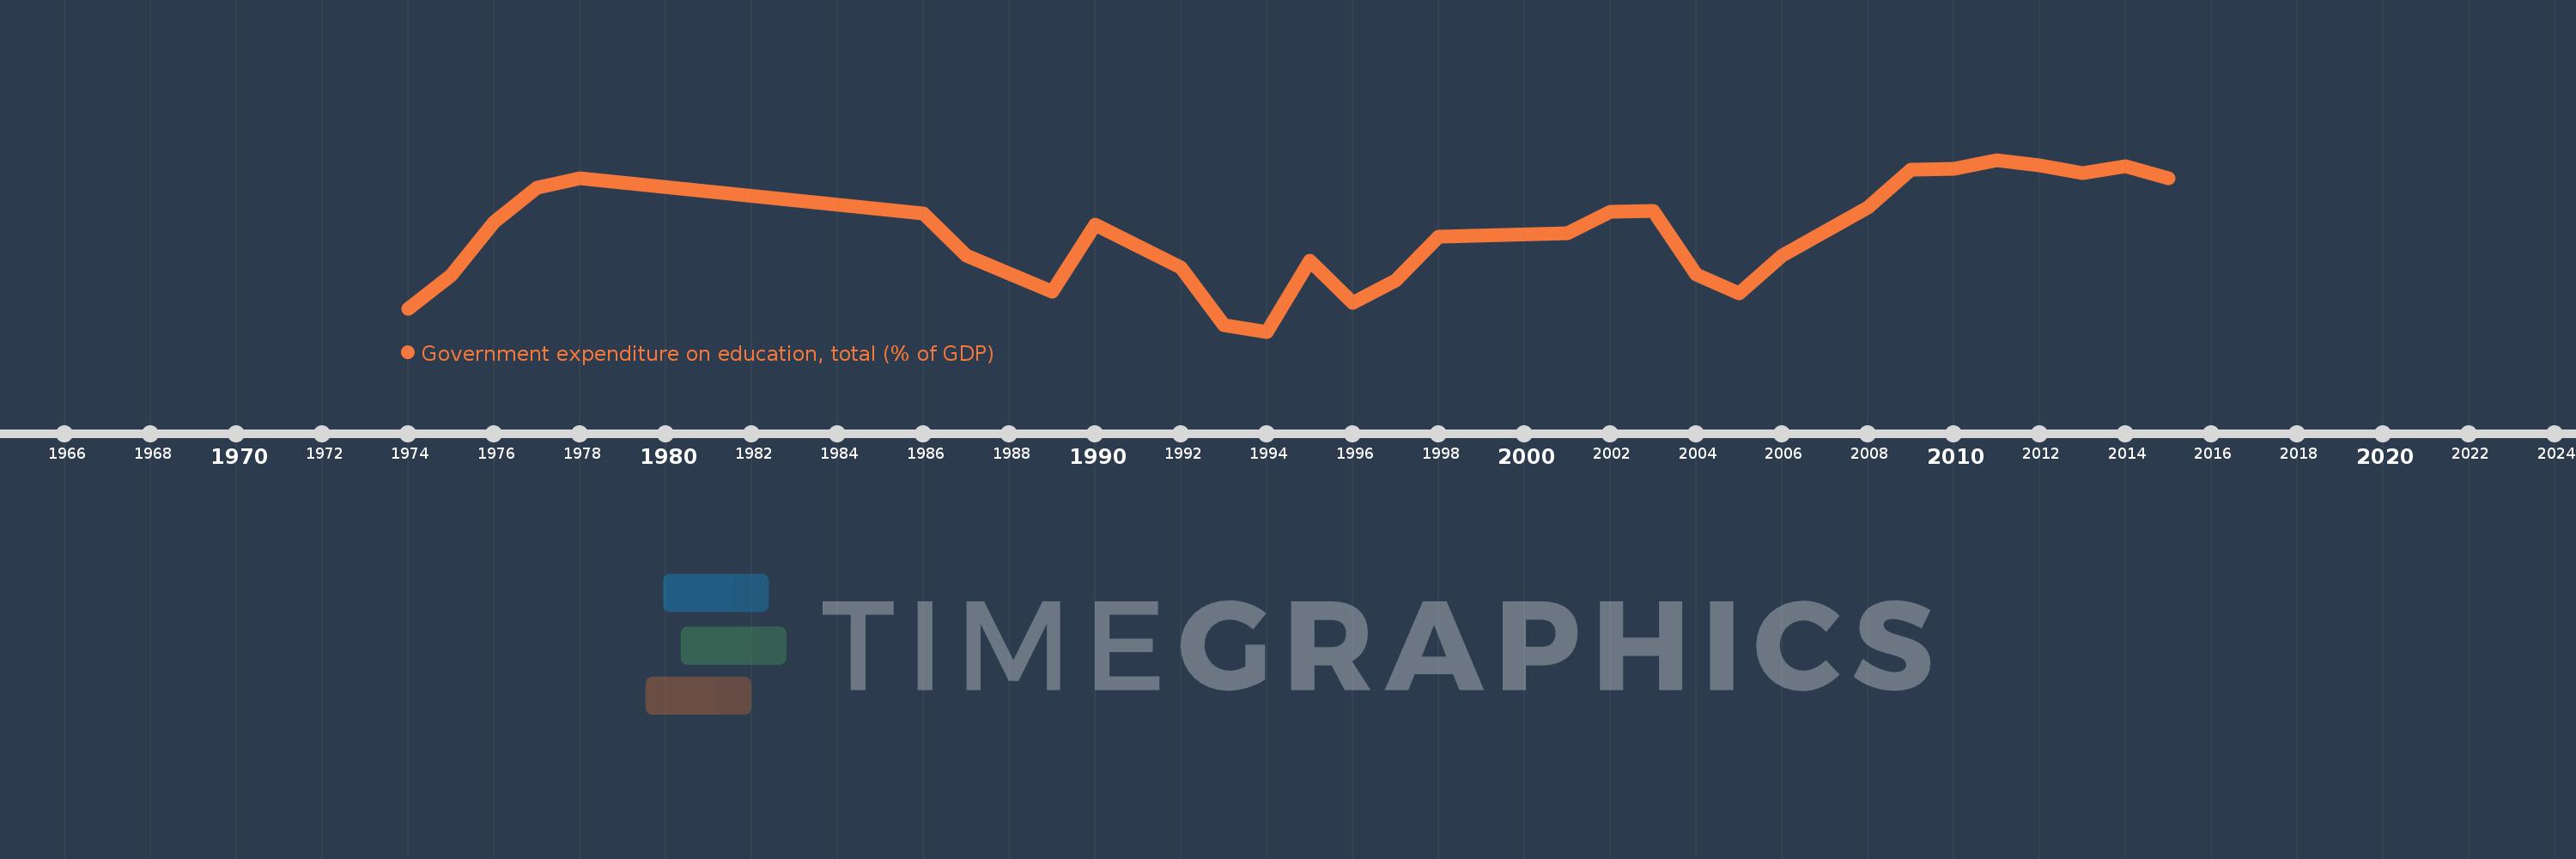
Jamaica
JAM
true
2
1
Government expenditure on education, total (% of GDP)
2015,2014,2013,2012,2011,2010,2009,2008,2006,2005,2004,2003,2002,2001,1998,1997,1996,1995,1994,1993,1992,1991,1990,1989,1987,1986,1978,1977,1976,1975,1974