33
/
AIzaSyB4mHJ5NPEv-XzF7P6NDYXjlkCWaeKw5bc
November 30, 2025
124837
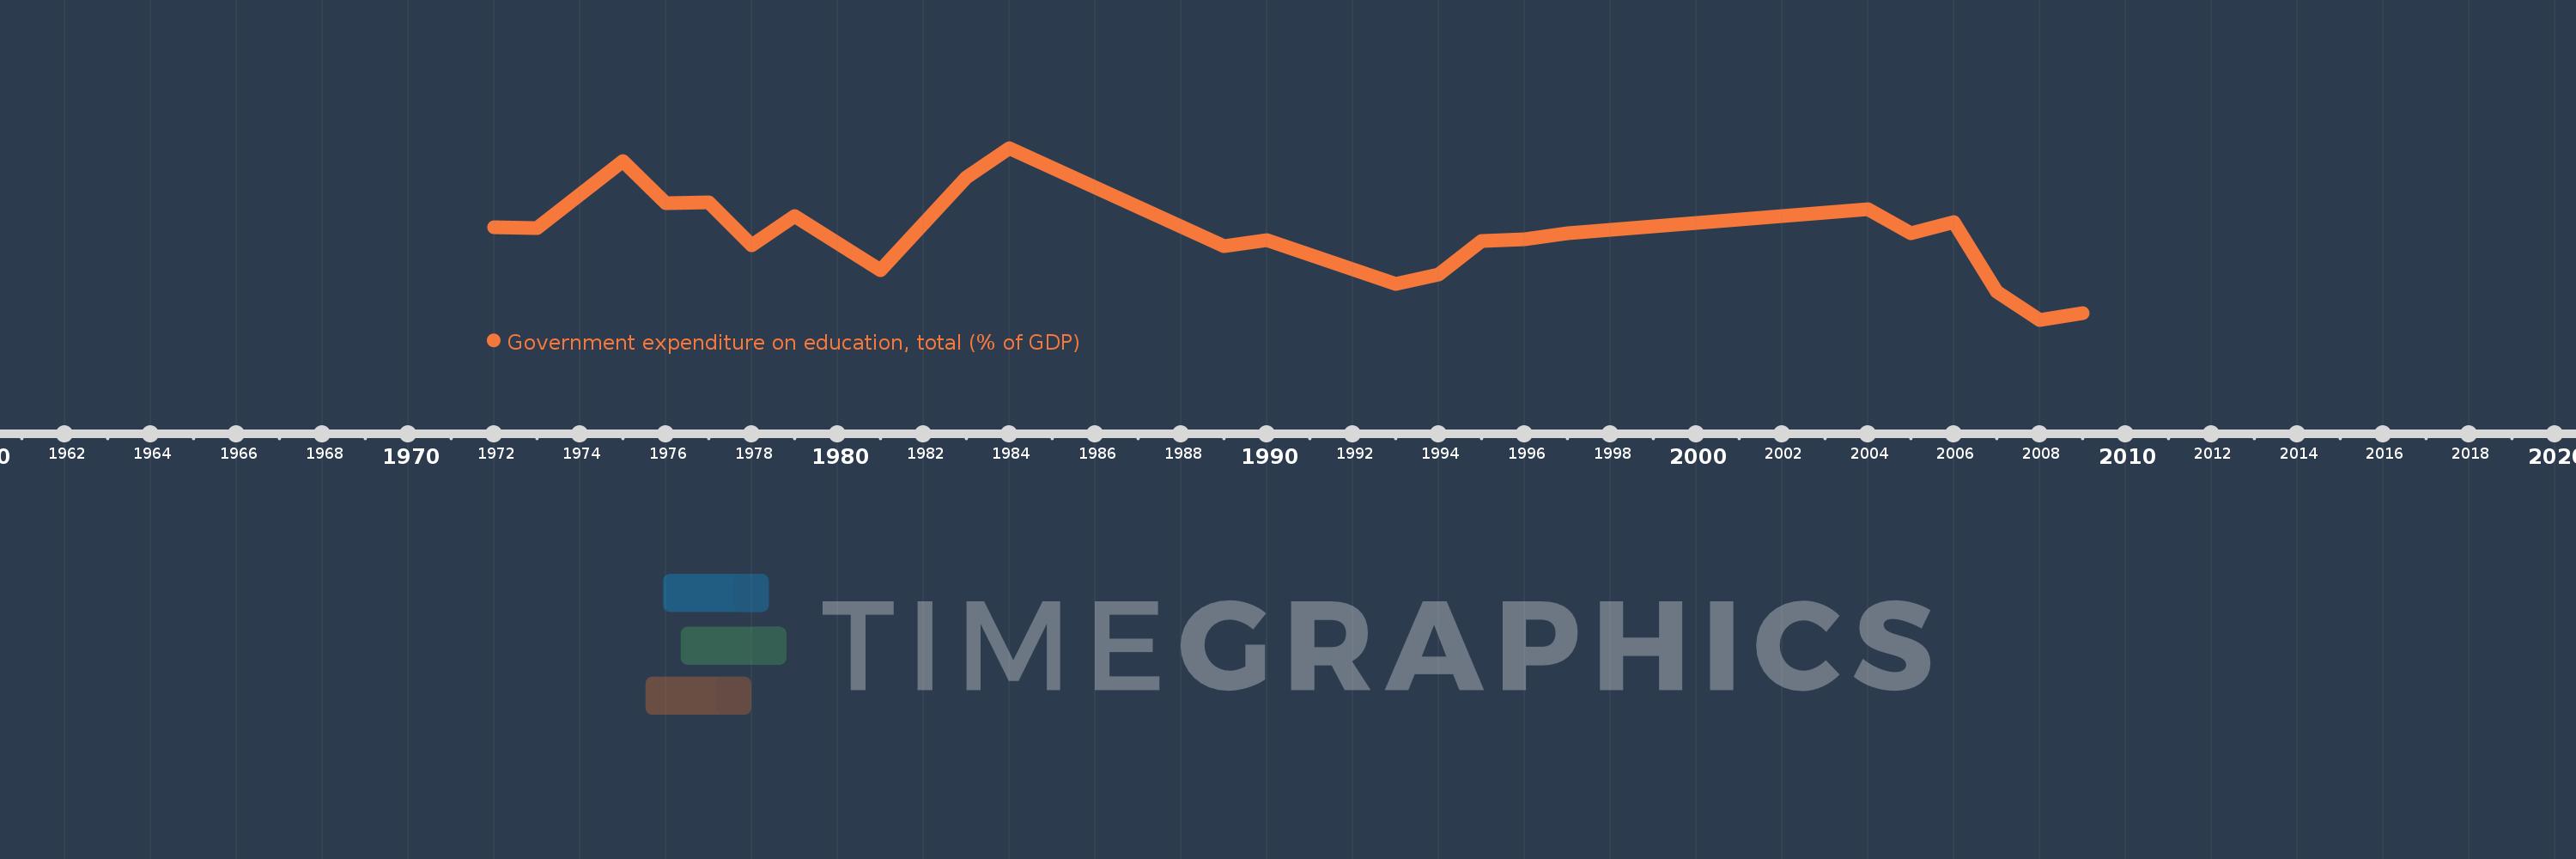
Egypt, Arab Rep.
EGY
true
2
1
Government expenditure on education, total (% of GDP)
2009,2008,2007,2006,2005,2004,1997,1996,1995,1994,1993,1990,1989,1984,1983,1981,1979,1978,1977,1976,1975,1973,1972