33
/
AIzaSyB4mHJ5NPEv-XzF7P6NDYXjlkCWaeKw5bc
November 30, 2025
177710
Lesotho
LSO
true
2
1
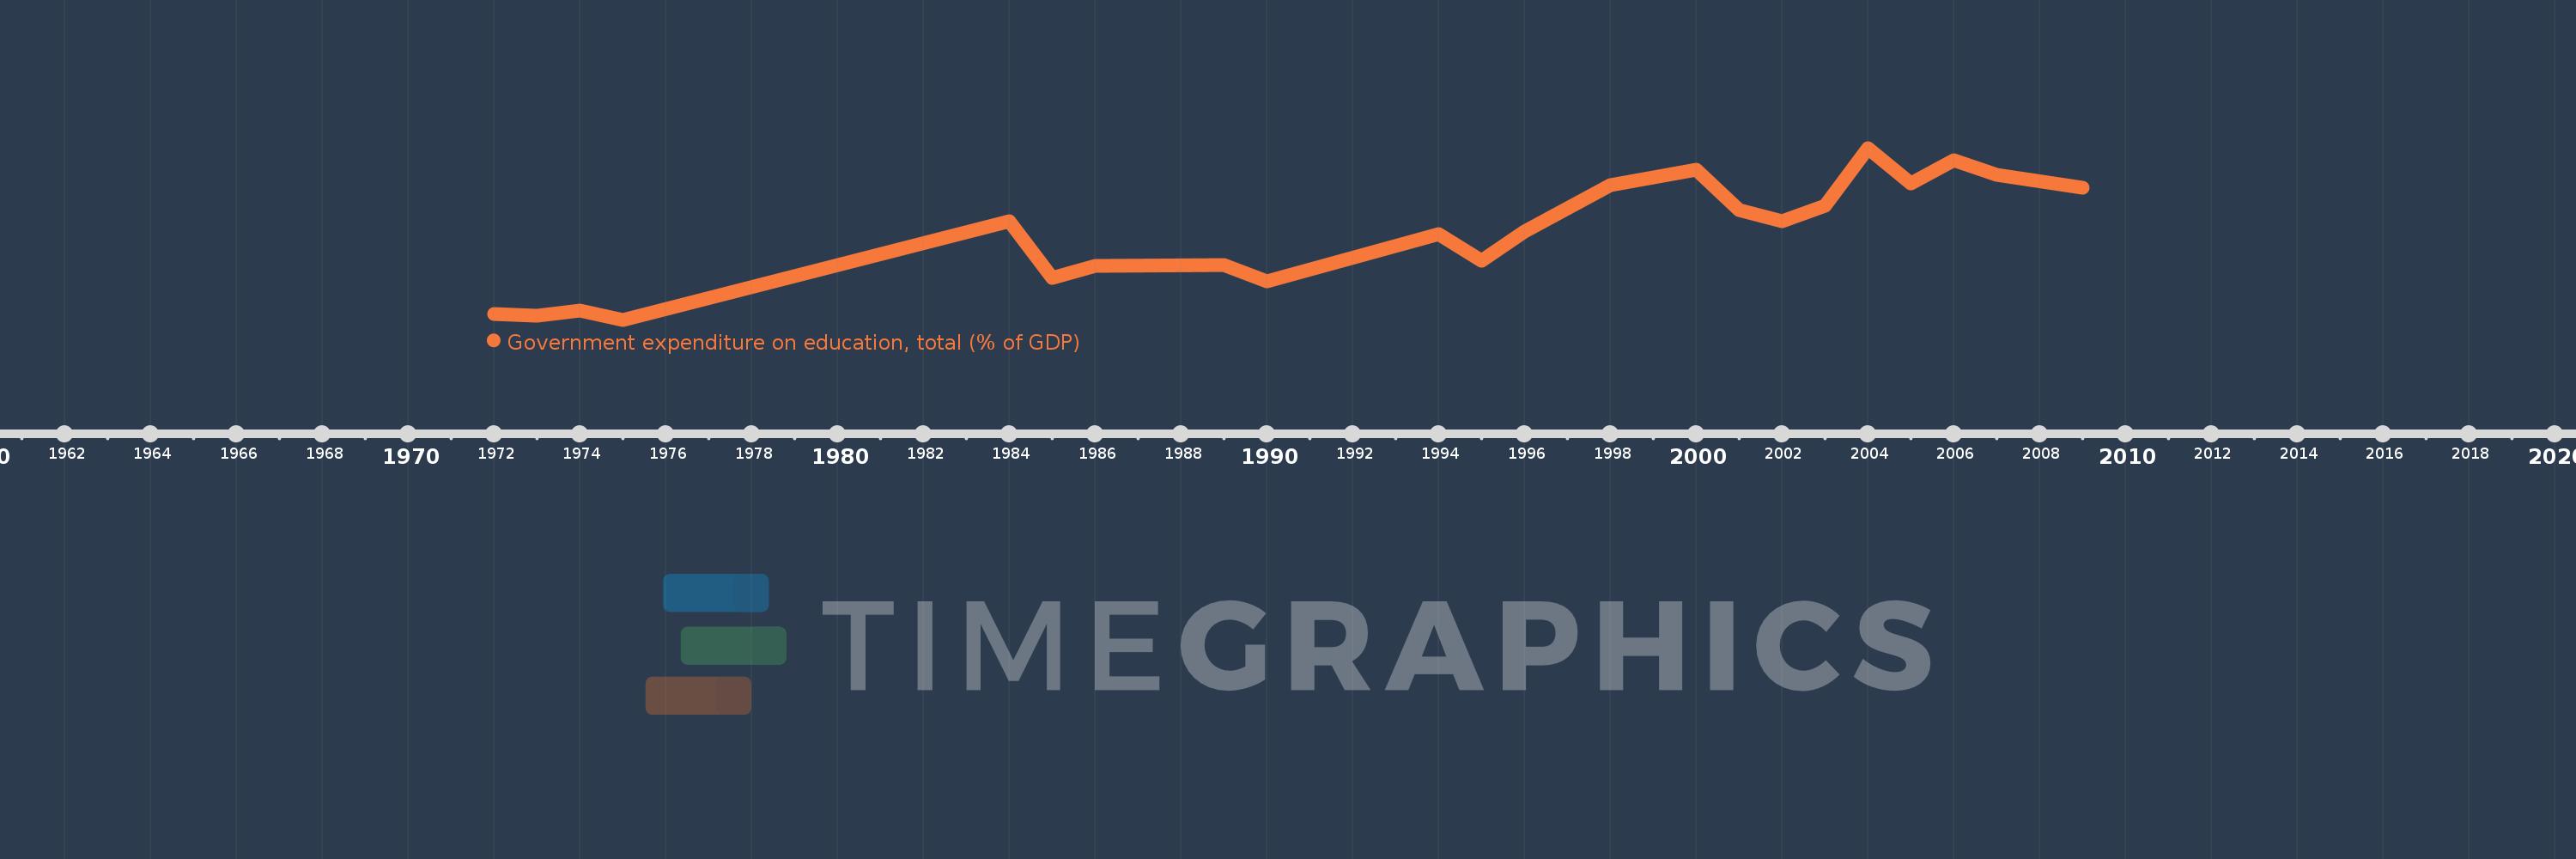
Government expenditure on education, total (% of GDP)
2009,2007,2006,2005,2004,2003,2002,2001,2000,1998,1996,1995,1994,1990,1989,1986,1985,1984,1975,1974,1973,1972