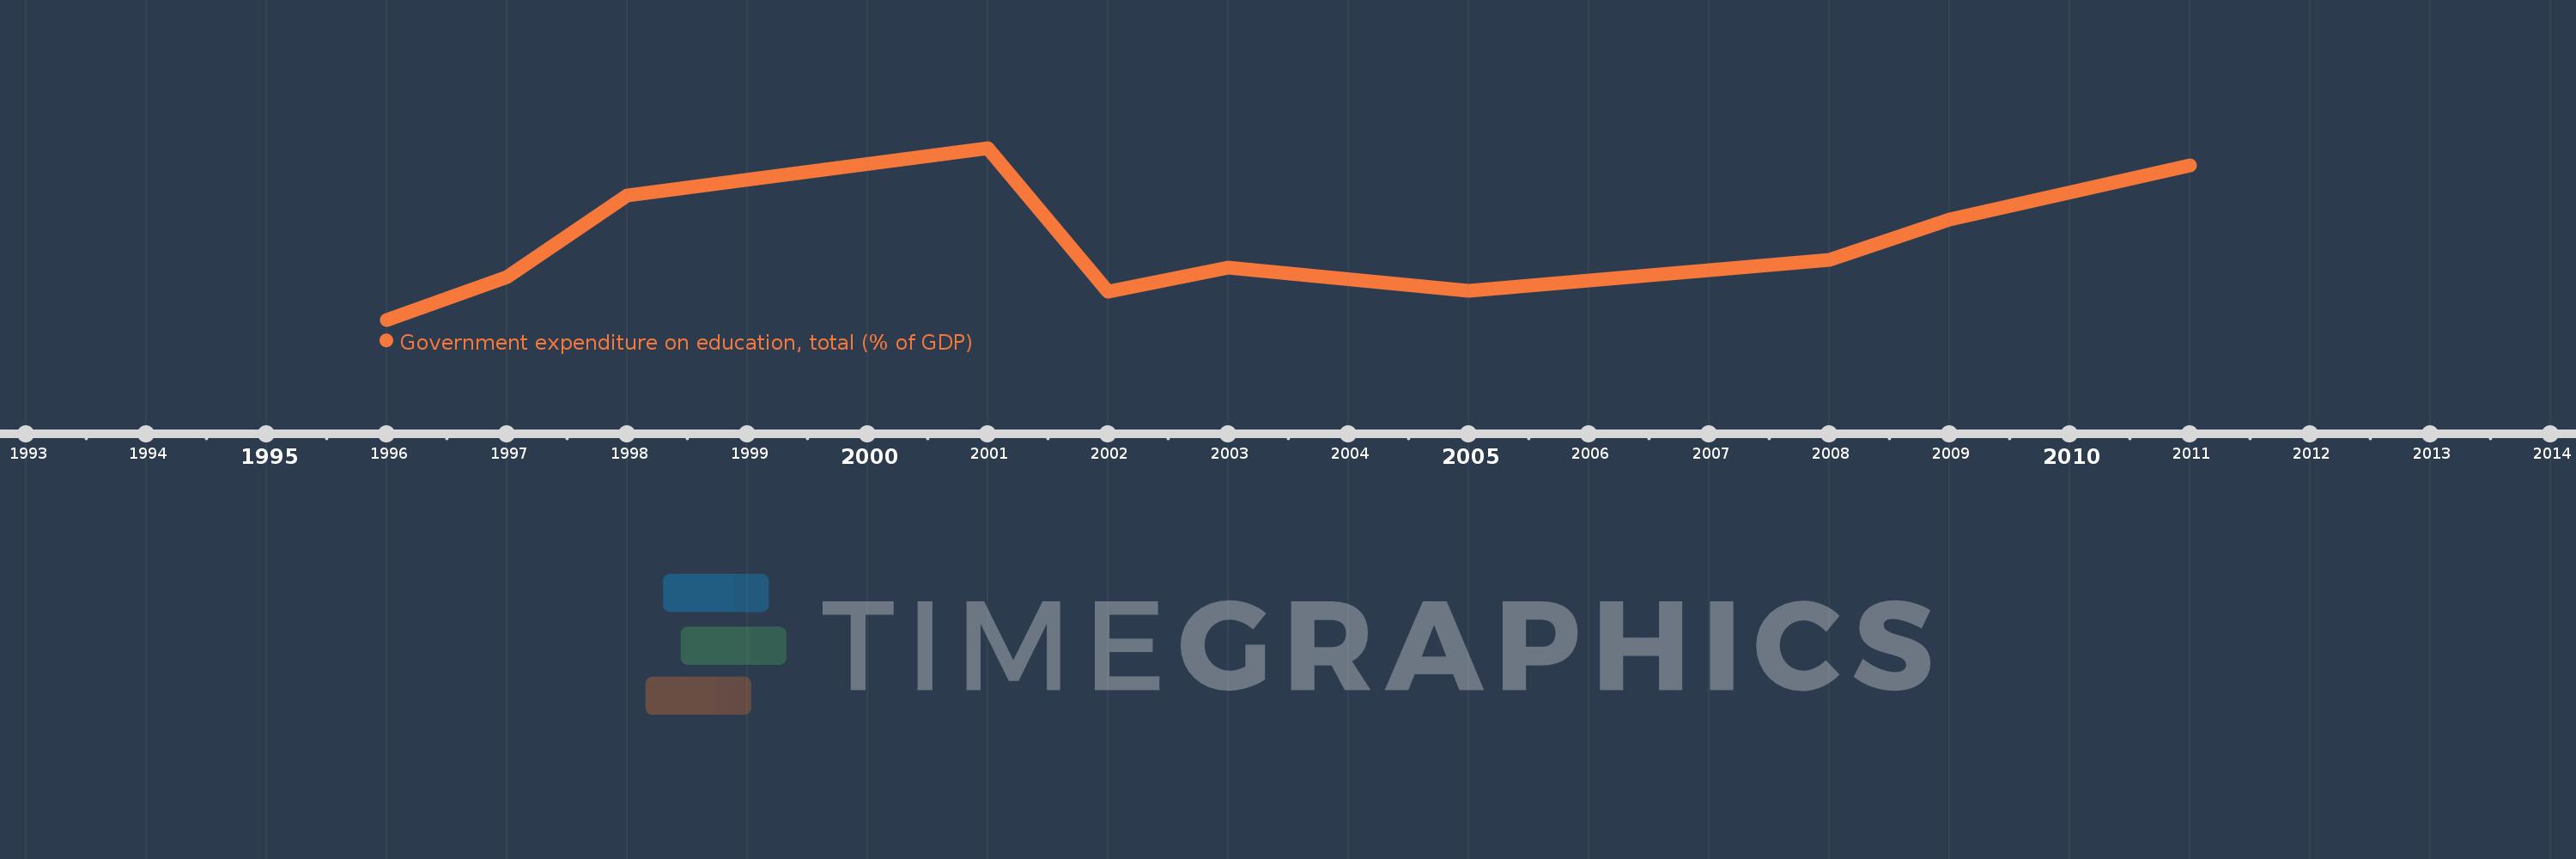
This timeline shows a graph from 1996 to 2011 of East Asia & Pacific (excluding high income). No data until 1995. Number of actual observations by date: 10.
Source name:
World Development Indicators
Source organization:
United Nations Educational, Scientific, and Cultural Organization (UNESCO) Institute for Statistics.
Categories, topics:
Education
Last updated:
apr 23, 2017
Indicators value changes by year
Meaning:
3.251
Minimum:
2.445
jan 1, 1996
Maximum:
4.261
jan 1, 2001
At the date of observation
Value
Absolute change
Change from the previous value
jan 1, 1996
2.445
+2.445
0.0%
jan 1, 1997
2.896
+0.451
18.45%
jan 1, 1998
3.756
+0.86
29.68%
jan 1, 2001
4.261
+0.505
13.43%
jan 1, 2002
2.743
-1.517
-35.61%
jan 1, 2003
2.997
+0.254
9.25%
jan 1, 2005
2.748
-0.249
-8.3%
jan 1, 2008
3.078
+0.33
12.01%
jan 1, 2009
3.509
+0.43
13.97%
jan 1, 2011
4.078
+0.569
16.22%
Ranking of countries by current statistics by years