33
/
AIzaSyB4mHJ5NPEv-XzF7P6NDYXjlkCWaeKw5bc
November 30, 2025
276680
United States
USA
true
2
1
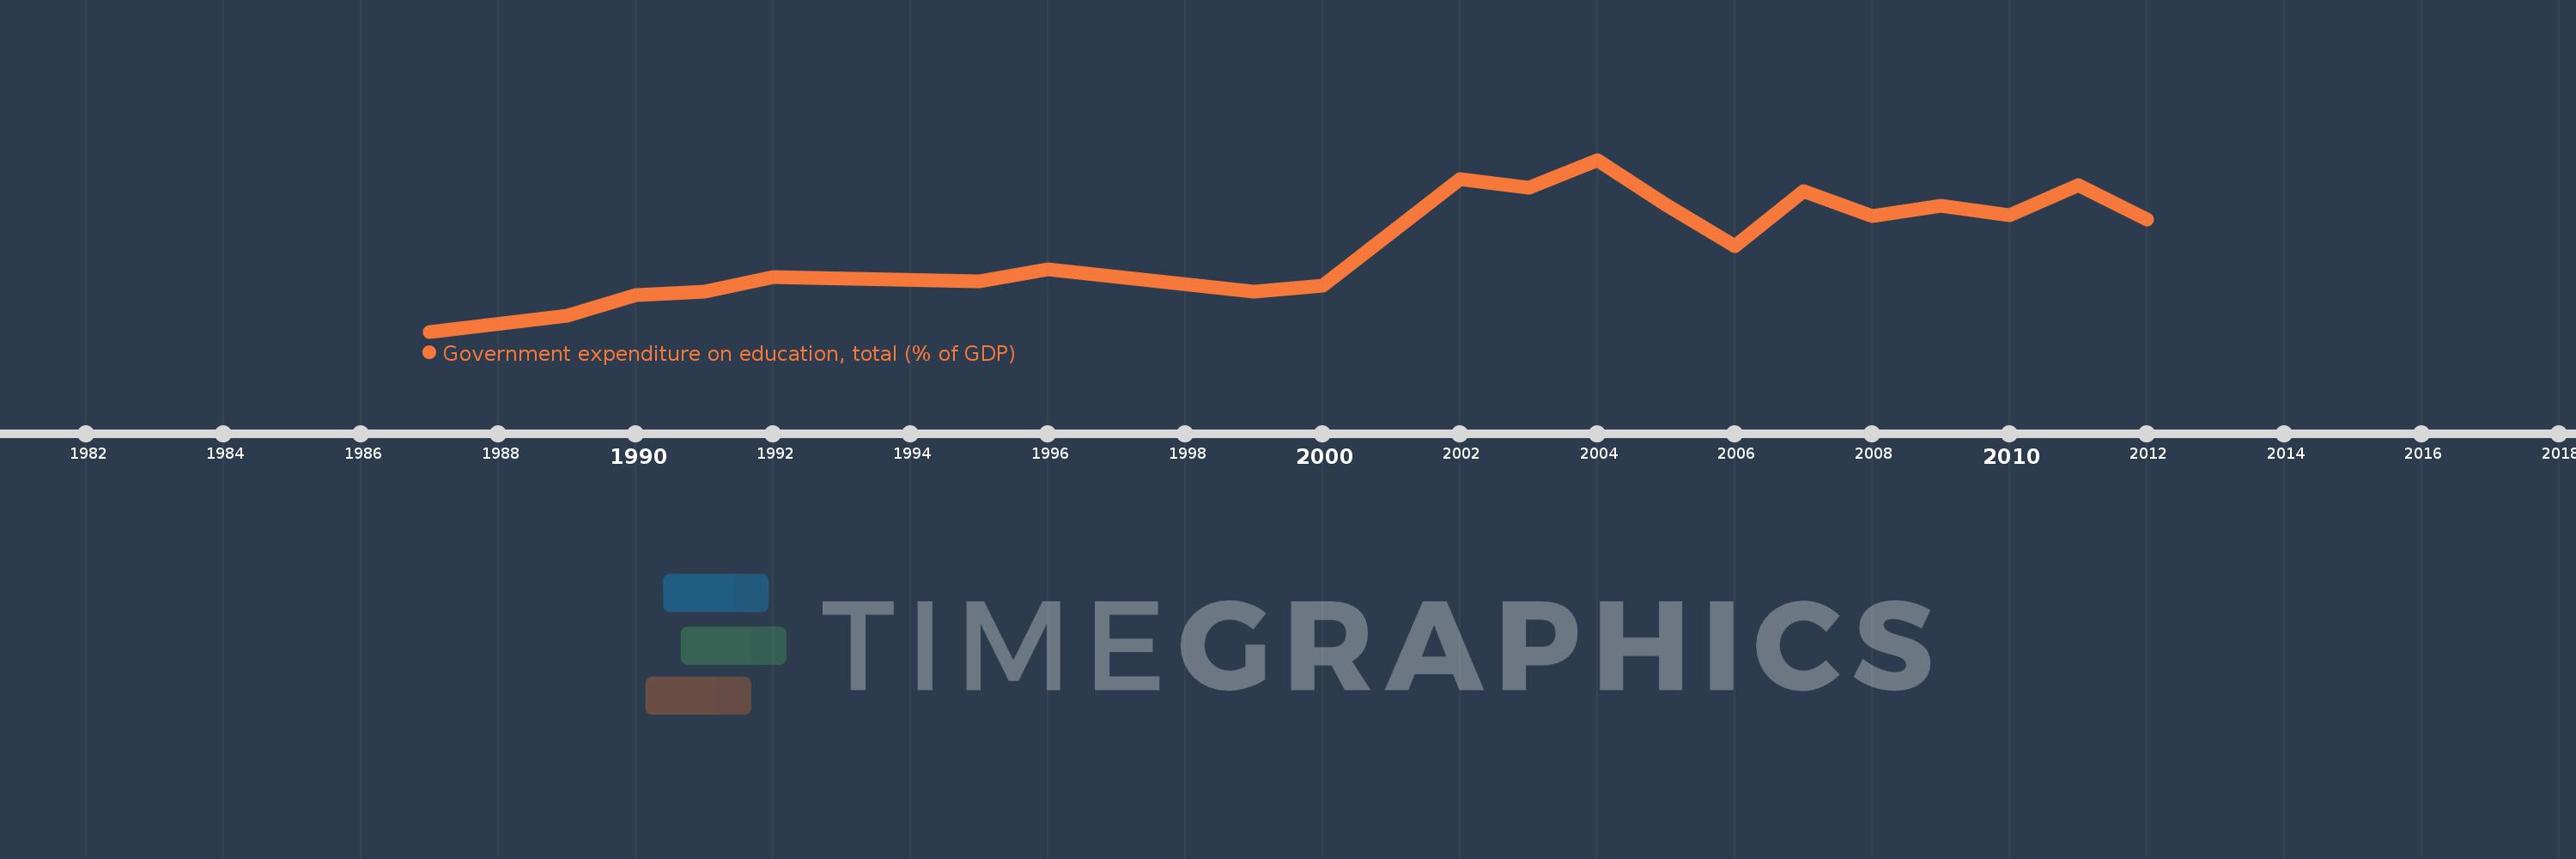
Government expenditure on education, total (% of GDP)
2012,2011,2010,2009,2008,2007,2006,2005,2004,2003,2002,2000,1999,1996,1995,1992,1991,1990,1989,1987