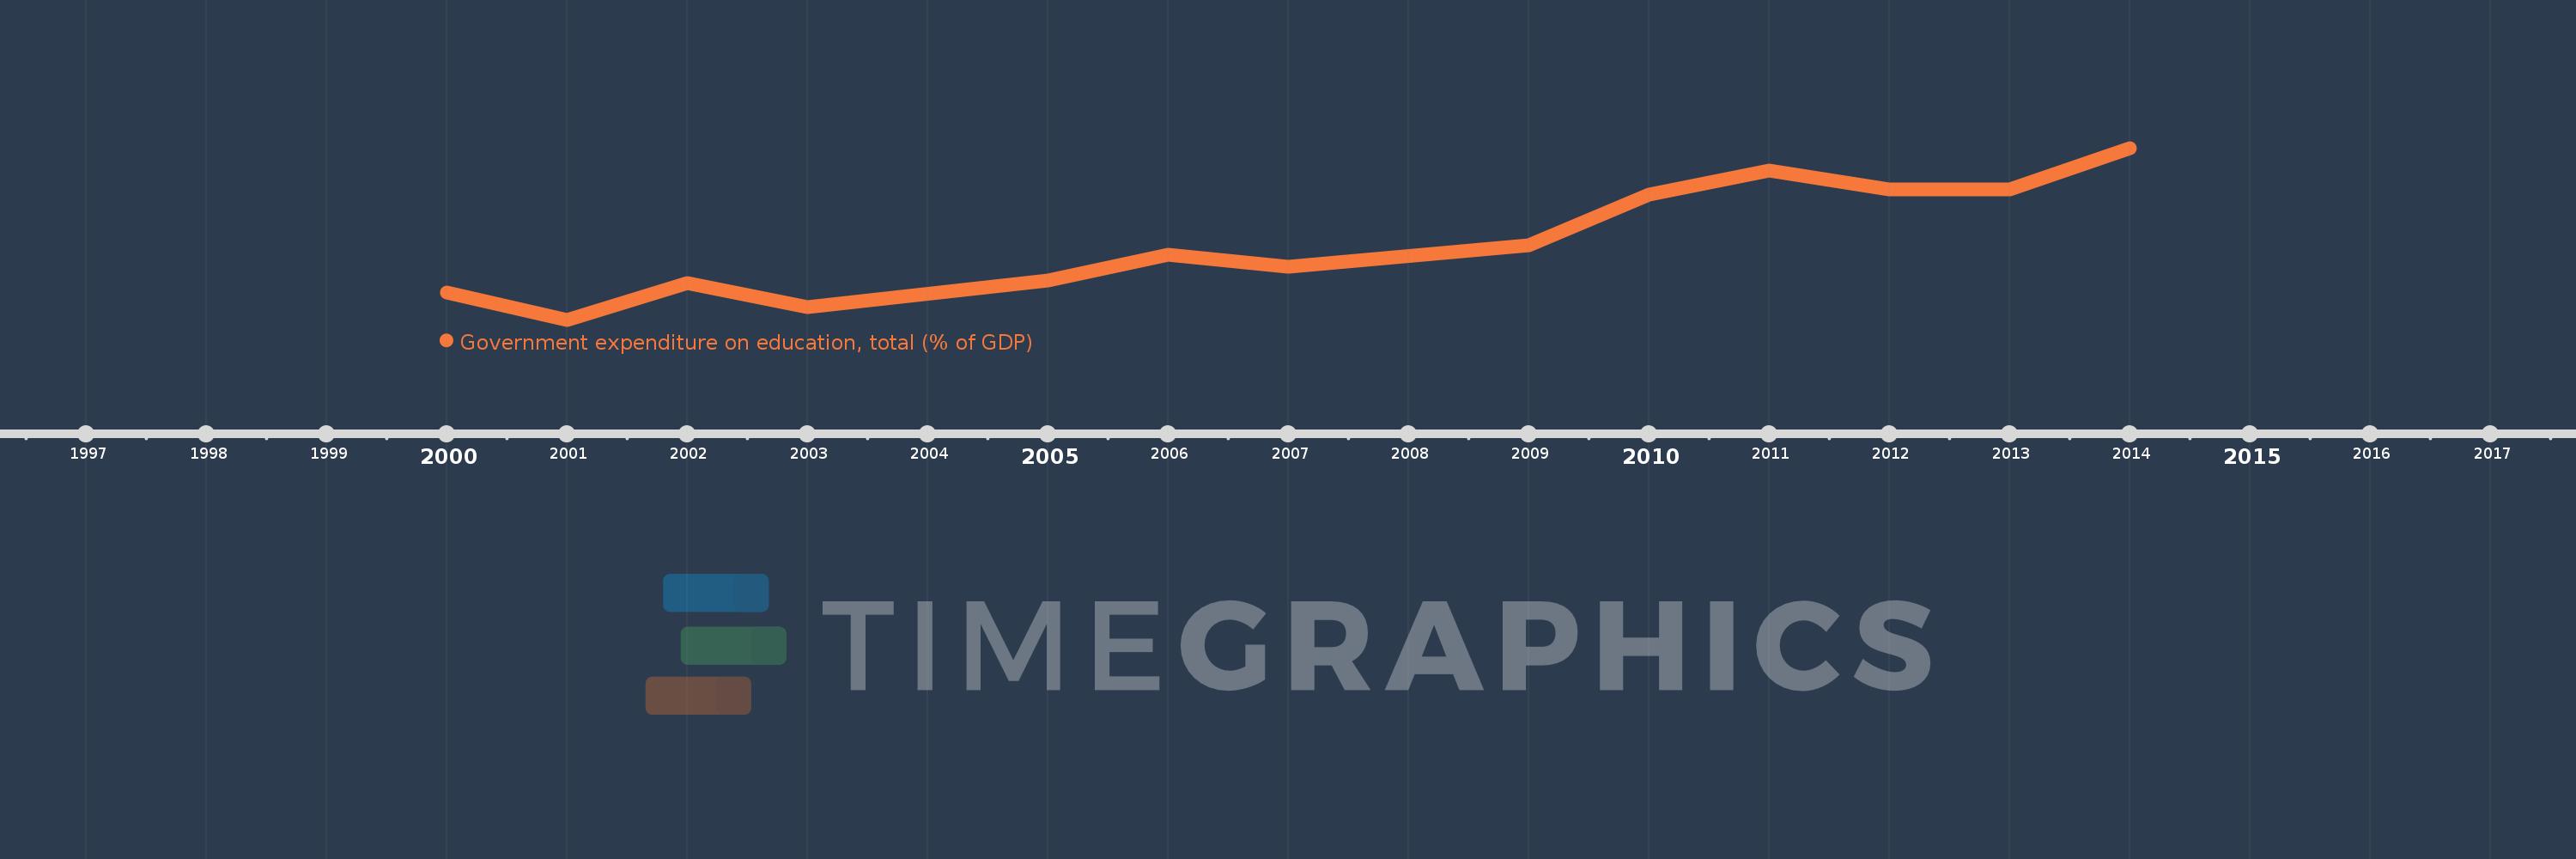
This timeline shows a graph from 2000 to 2014 of Heavily indebted poor countries (HIPC). No data until 1999. Number of actual observations by date: 13.
Source name:
World Development Indicators
Source organization:
United Nations Educational, Scientific, and Cultural Organization (UNESCO) Institute for Statistics.
Categories, topics:
Education
Last updated:
apr 23, 2017
Indicators value changes by year
Meaning:
3.635
Minimum:
2.956
jan 1, 2001
Maximum:
4.452
jan 1, 2014
At the date of observation
Value
Absolute change
Change from the previous value
jan 1, 2000
3.19
+3.19
0.0%
jan 1, 2001
2.956
-0.233
-7.31%
jan 1, 2002
3.273
+0.316
10.69%
jan 1, 2003
3.064
-0.209
-6.38%
jan 1, 2005
3.297
+0.233
7.62%
jan 1, 2006
3.519
+0.222
6.73%
jan 1, 2007
3.419
-0.1
-2.85%
jan 1, 2009
3.608
+0.189
5.53%
jan 1, 2010
4.044
+0.436
12.09%
jan 1, 2011
4.255
+0.211
5.22%
jan 1, 2012
4.088
-0.167
-3.92%
jan 1, 2013
4.09
+0.002
0.05%
jan 1, 2014
4.452
+0.362
8.85%
Ranking of countries by current statistics by years