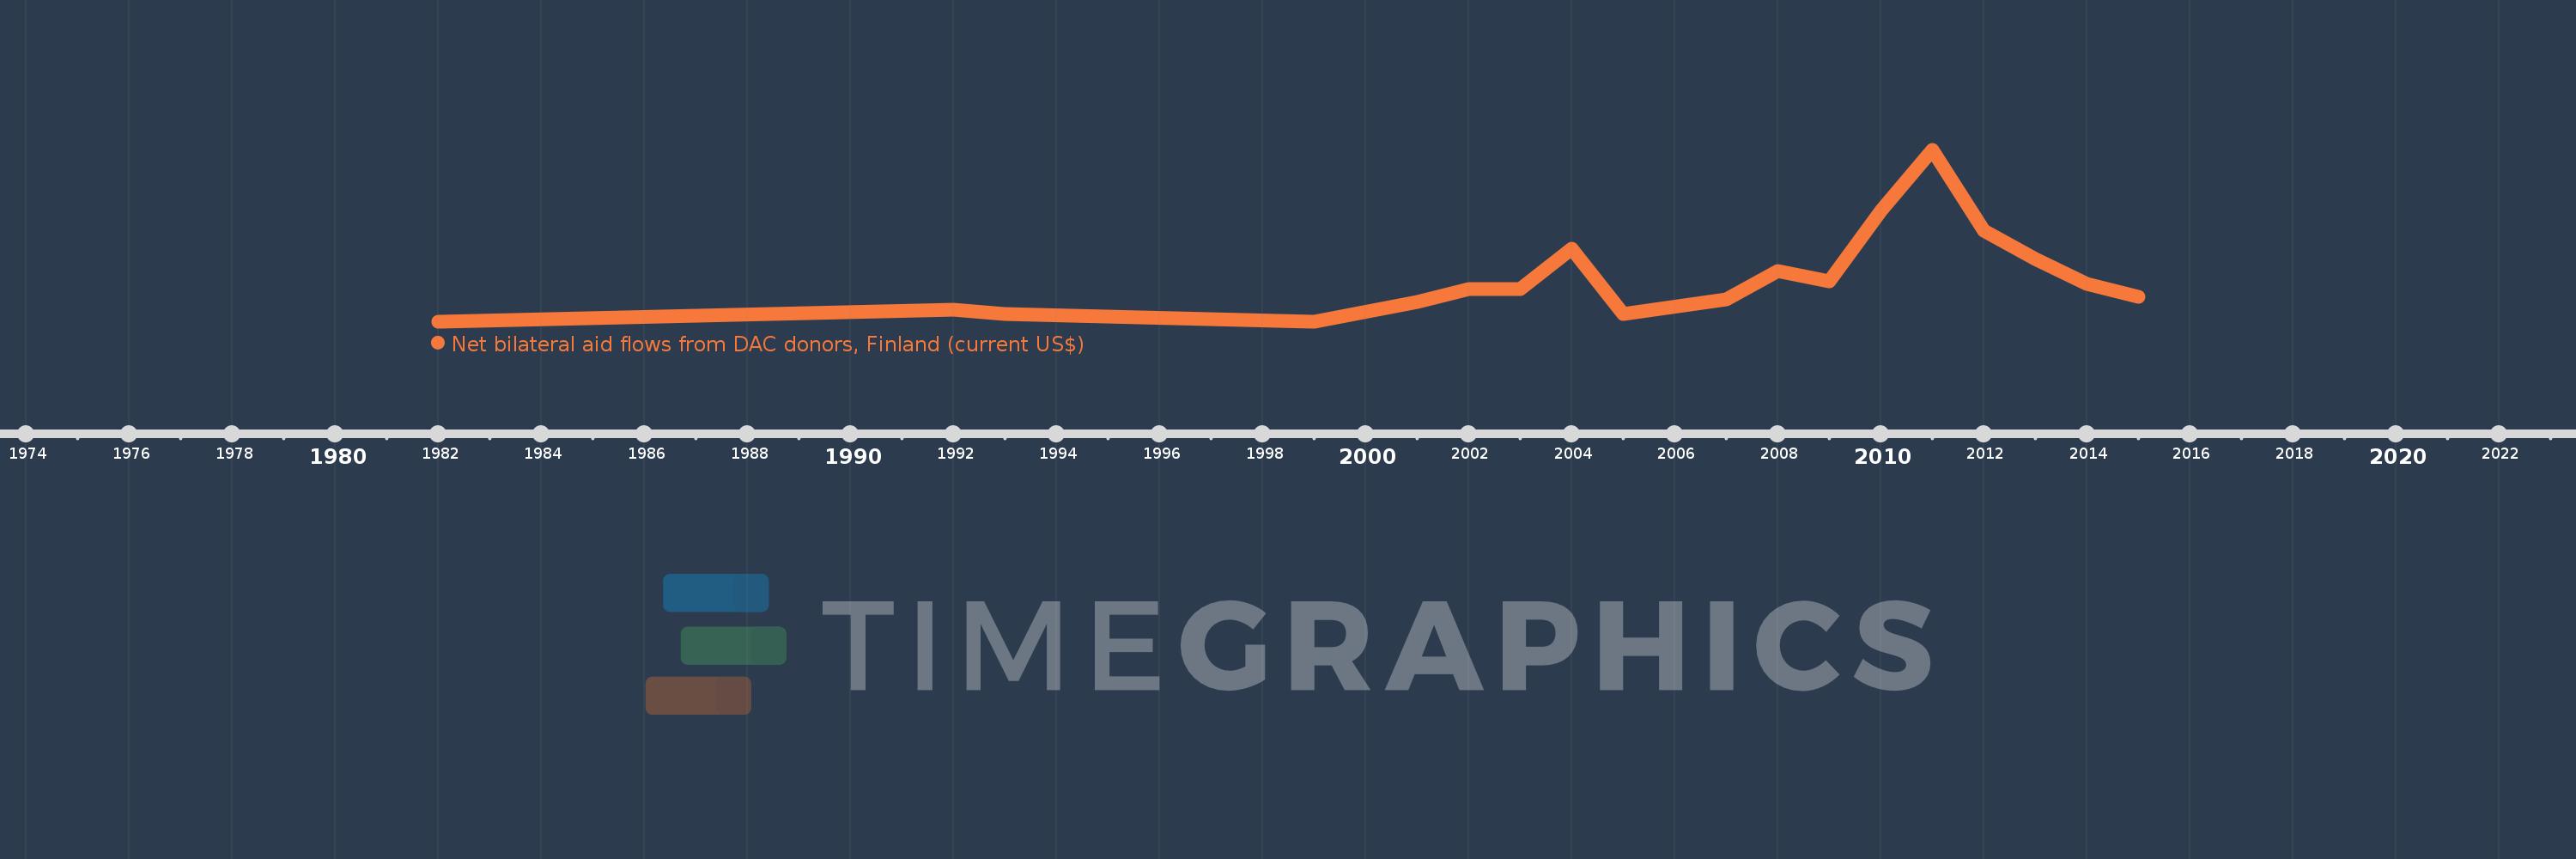
This timeline shows a graph from 1982 to 2015 of Benin. No data until 1981. Number of actual observations by date: 18.
Source name:
World Development Indicators
Source organization:
Development Assistance Committee of the Organisation for Economic Co-operation and Development, Geographical Distribution of Financial Flows to Developing Countries, Development Co-operation Report, and International Development Statistics database. Data are available online at: www.oecd.org/dac/stats/idsonline.
Categories, topics:
Aid Effectiveness
Last updated:
apr 23, 2017
Indicators value changes by year
Meaning:
186.111K
Minimum:
10.0K
jan 1, 1982
Maximum:
690.0K
jan 1, 2011
At the date of observation
Value
Absolute change
Change from the previous value
jan 1, 1982
10.0K
+10.0K
0.0%
jan 1, 1992
60.0K
+50.0K
500.0%
jan 1, 1993
40.0K
-20.0K
-33.33%
jan 1, 1999
10.0K
-30.0K
-75.0%
jan 1, 2001
90.0K
+80.0K
800.0%
jan 1, 2002
140.0K
+50.0K
55.56%
jan 1, 2003
140.0K
0.0
0.0%
jan 1, 2004
300.0K
+160.0K
114.29%
jan 1, 2005
40.0K
-260.0K
-86.67%
jan 1, 2007
100.0K
+60.0K
150.0%
jan 1, 2008
210.0K
+110.0K
110.0%
jan 1, 2009
170.0K
-40.0K
-19.05%
jan 1, 2010
450.0K
+280.0K
164.71%
jan 1, 2011
690.0K
+240.0K
53.33%
jan 1, 2012
370.0K
-320.0K
-46.38%
jan 1, 2013
260.0K
-110.0K
-29.73%
jan 1, 2014
160.0K
-100.0K
-38.46%
jan 1, 2015
110.0K
-50.0K
-31.25%
Ranking of countries by current statistics by years