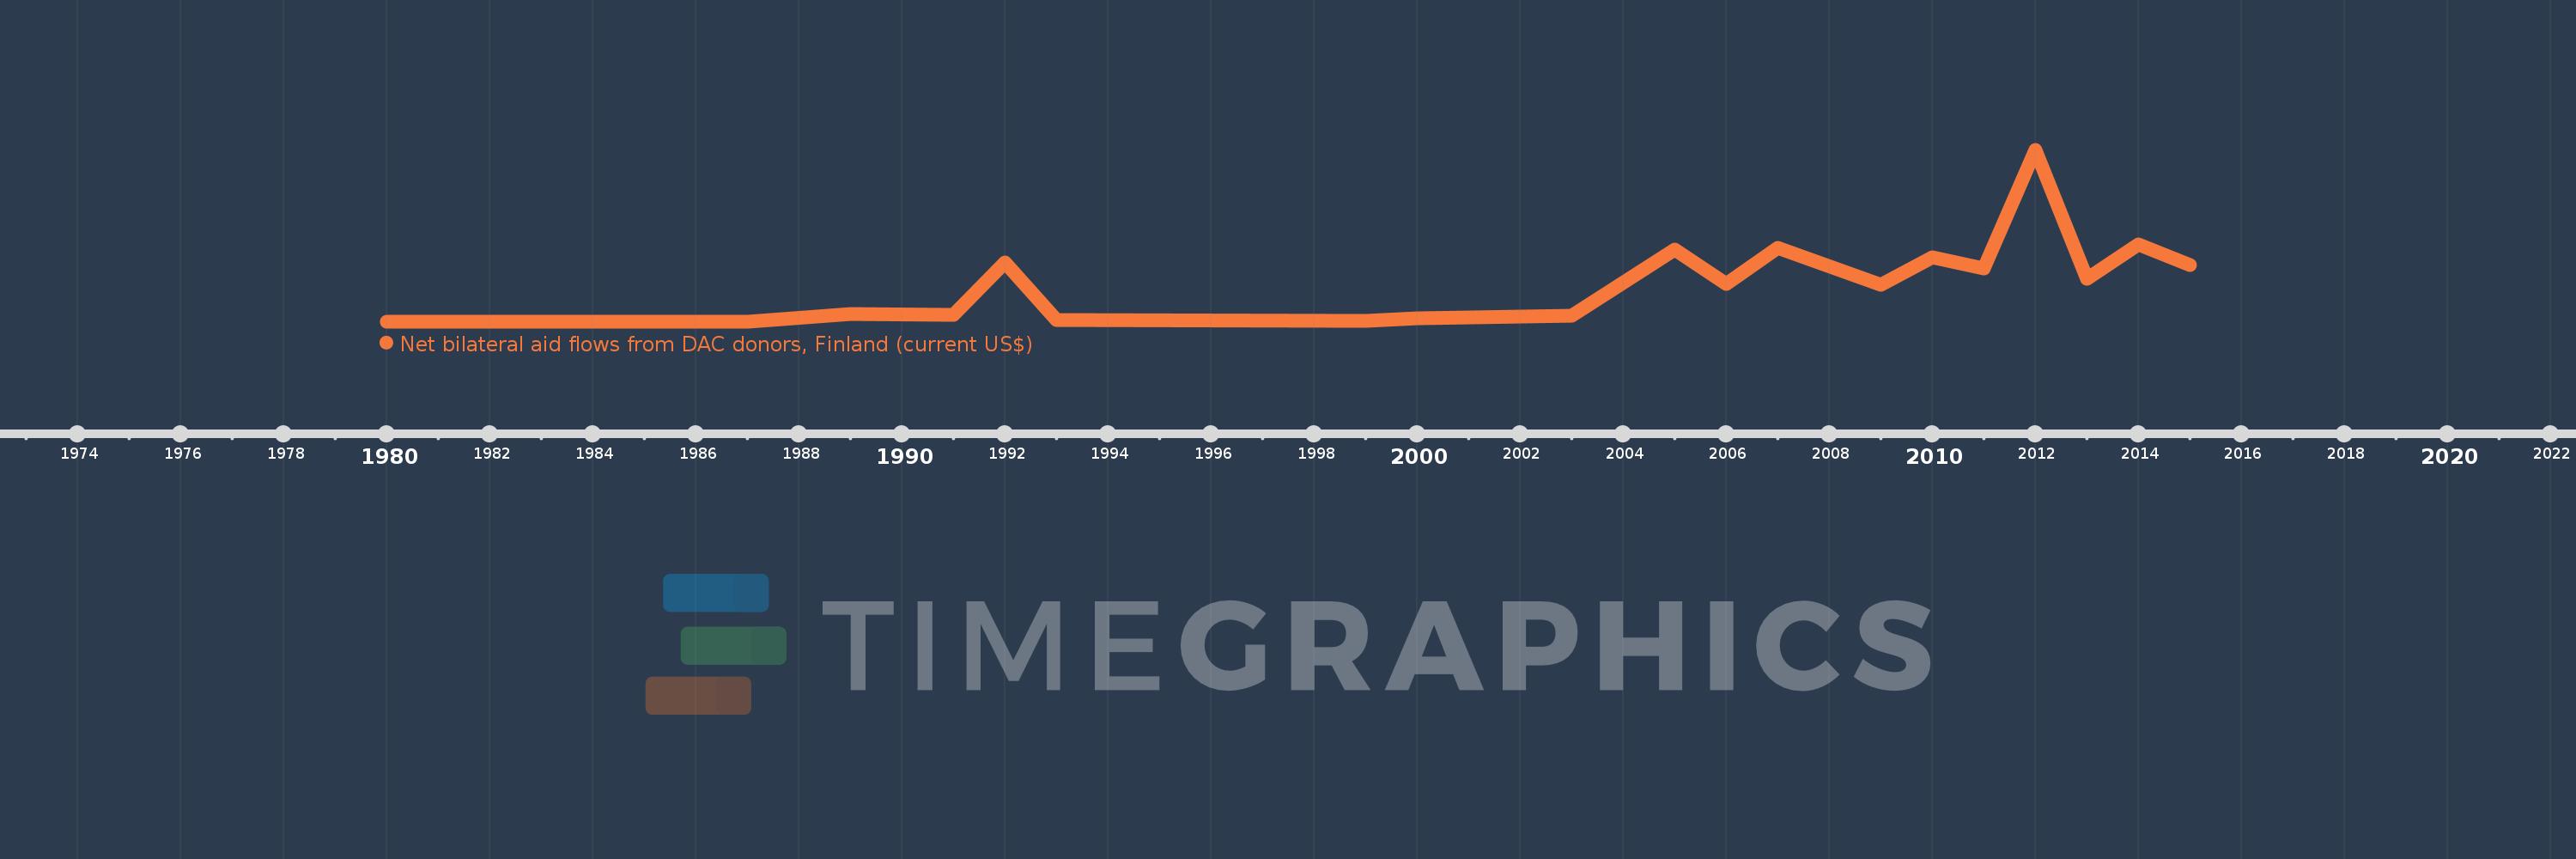
This timeline shows a graph from 1980 to 2015 of Cote d'Ivoire. No data until 1979. Number of actual observations by date: 20.
Source name:
World Development Indicators
Source organization:
Development Assistance Committee of the Organisation for Economic Co-operation and Development, Geographical Distribution of Financial Flows to Developing Countries, Development Co-operation Report, and International Development Statistics database. Data are available online at: www.oecd.org/dac/stats/idsonline.
Categories, topics:
Aid Effectiveness
Last updated:
apr 23, 2017
Indicators value changes by year
Meaning:
336.0K
Minimum:
10.0K
jan 1, 1980
Maximum:
1.45 mln
jan 1, 2012
At the date of observation
Value
Absolute change
Change from the previous value
jan 1, 1980
10.0K
+10.0K
0.0%
jan 1, 1986
10.0K
0.0
0.0%
jan 1, 1987
10.0K
0.0
0.0%
jan 1, 1989
80.0K
+70.0K
700.0%
jan 1, 1991
70.0K
-10.0K
-12.5%
jan 1, 1992
510.0K
+440.0K
628.57%
jan 1, 1993
30.0K
-480.0K
-94.12%
jan 1, 1999
20.0K
-10.0K
-33.33%
jan 1, 2000
40.0K
+20.0K
100.0%
jan 1, 2003
60.0K
+20.0K
50.0%
jan 1, 2005
620.0K
+560.0K
933.33%
jan 1, 2006
330.0K
-290.0K
-46.77%
jan 1, 2007
630.0K
+300.0K
90.91%
jan 1, 2009
320.0K
-310.0K
-49.21%
jan 1, 2010
550.0K
+230.0K
71.88%
jan 1, 2011
460.0K
-90.0K
-16.36%
jan 1, 2012
1.45 mln
+990.0K
215.22%
jan 1, 2013
370.0K
-1.08 mln
-74.48%
jan 1, 2014
660.0K
+290.0K
78.38%
jan 1, 2015
490.0K
-170.0K
-25.76%
Ranking of countries by current statistics by years