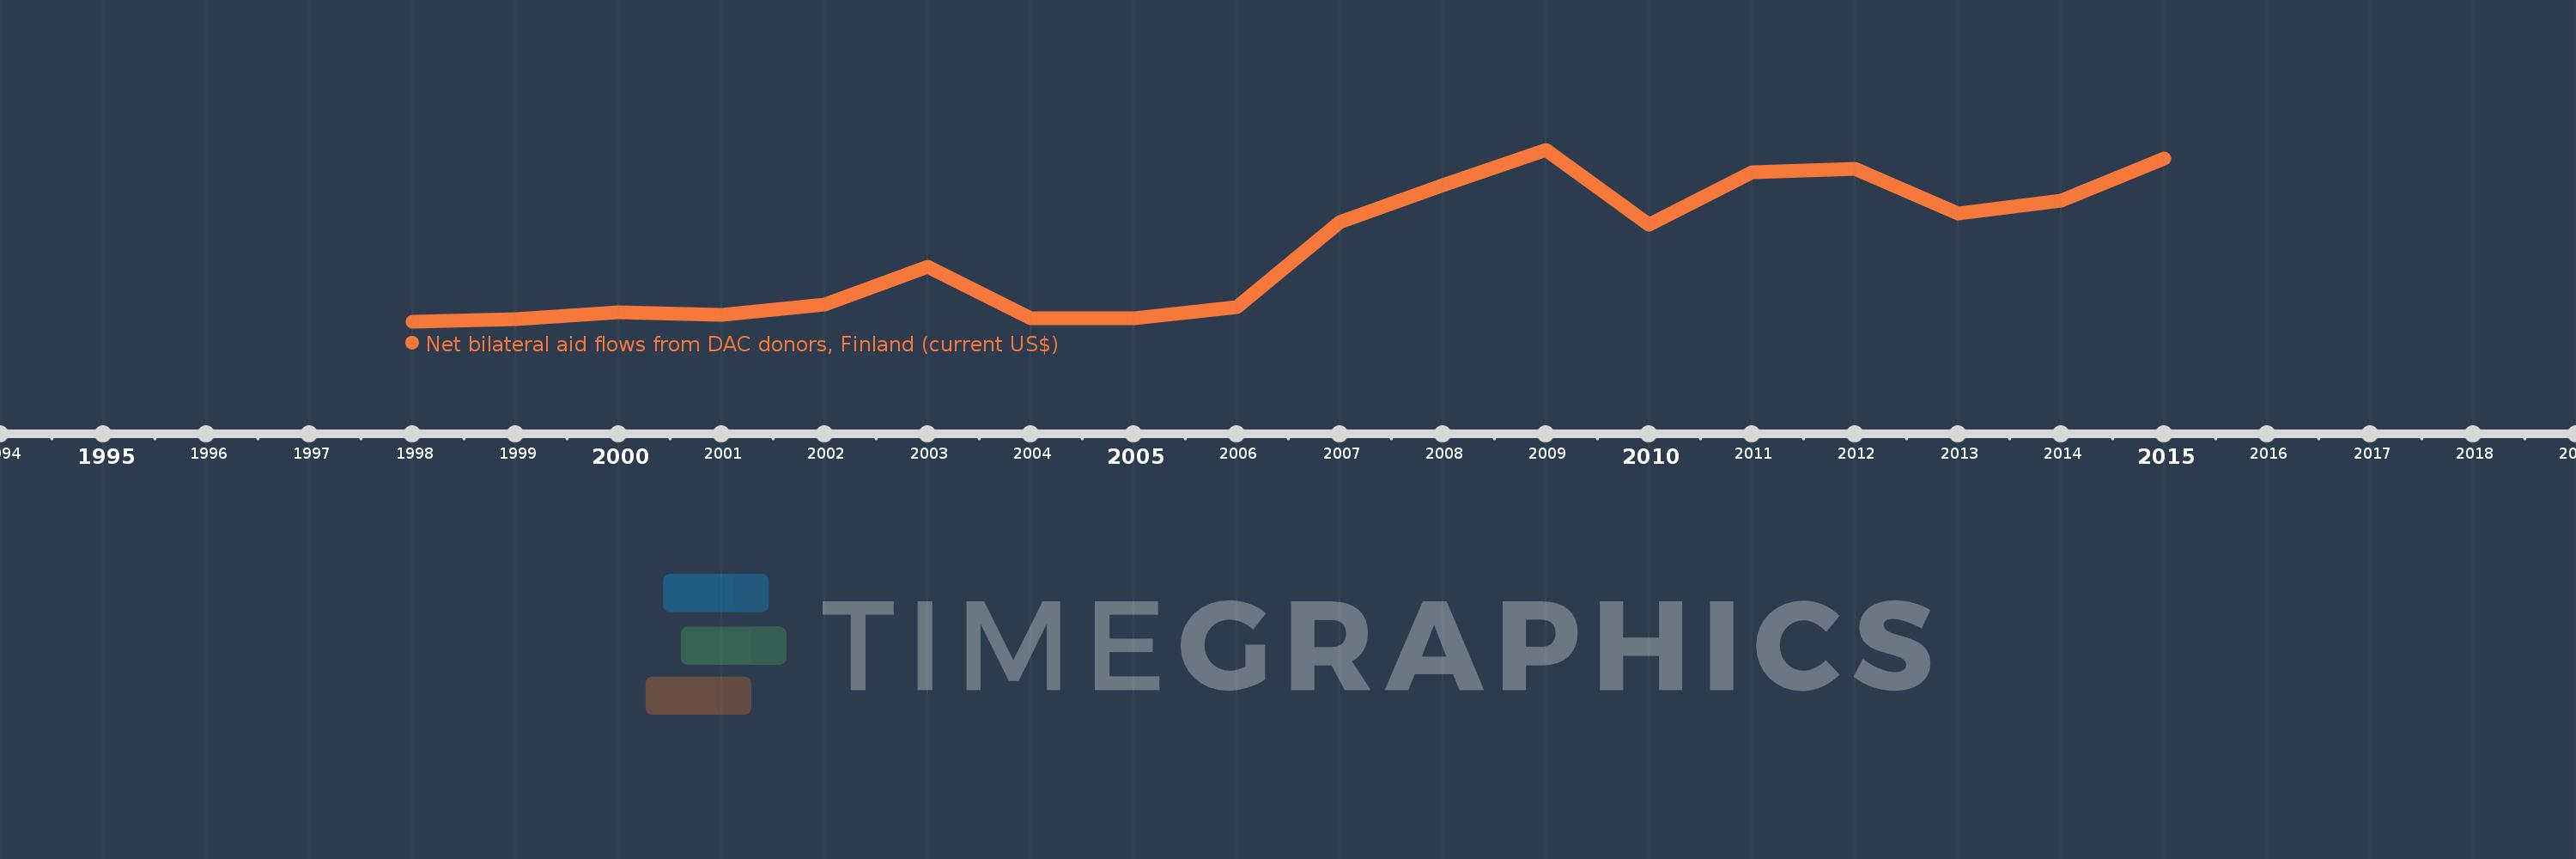
This timeline shows a graph from 1998 to 2015 of Moldova. No data until 1997. Number of actual observations by date: 18.
Source name:
World Development Indicators
Source organization:
Development Assistance Committee of the Organisation for Economic Co-operation and Development, Geographical Distribution of Financial Flows to Developing Countries, Development Co-operation Report, and International Development Statistics database. Data are available online at: www.oecd.org/dac/stats/idsonline.
Categories, topics:
Aid Effectiveness
Last updated:
apr 23, 2017
Indicators value changes by year
Meaning:
602.222K
Minimum:
10.0K
jan 1, 1998
Maximum:
1.4 mln
jan 1, 2009
At the date of observation
Value
Absolute change
Change from the previous value
jan 1, 1998
10.0K
+10.0K
0.0%
jan 1, 1999
30.0K
+20.0K
200.0%
jan 1, 2000
90.0K
+60.0K
200.0%
jan 1, 2001
70.0K
-20.0K
-22.22%
jan 1, 2002
150.0K
+80.0K
114.29%
jan 1, 2003
460.0K
+310.0K
206.67%
jan 1, 2004
40.0K
-420.0K
-91.3%
jan 1, 2005
40.0K
0.0
0.0%
jan 1, 2006
130.0K
+90.0K
225.0%
jan 1, 2007
820.0K
+690.0K
530.77%
jan 1, 2008
1.12 mln
+300.0K
36.59%
jan 1, 2009
1.4 mln
+280.0K
25.0%
jan 1, 2010
800.0K
-600.0K
-42.86%
jan 1, 2011
1.22 mln
+420.0K
52.5%
jan 1, 2012
1.25 mln
+30.0K
2.46%
jan 1, 2013
890.0K
-360.0K
-28.8%
jan 1, 2014
990.0K
+100.0K
11.24%
jan 1, 2015
1.33 mln
+340.0K
34.34%
Ranking of countries by current statistics by years