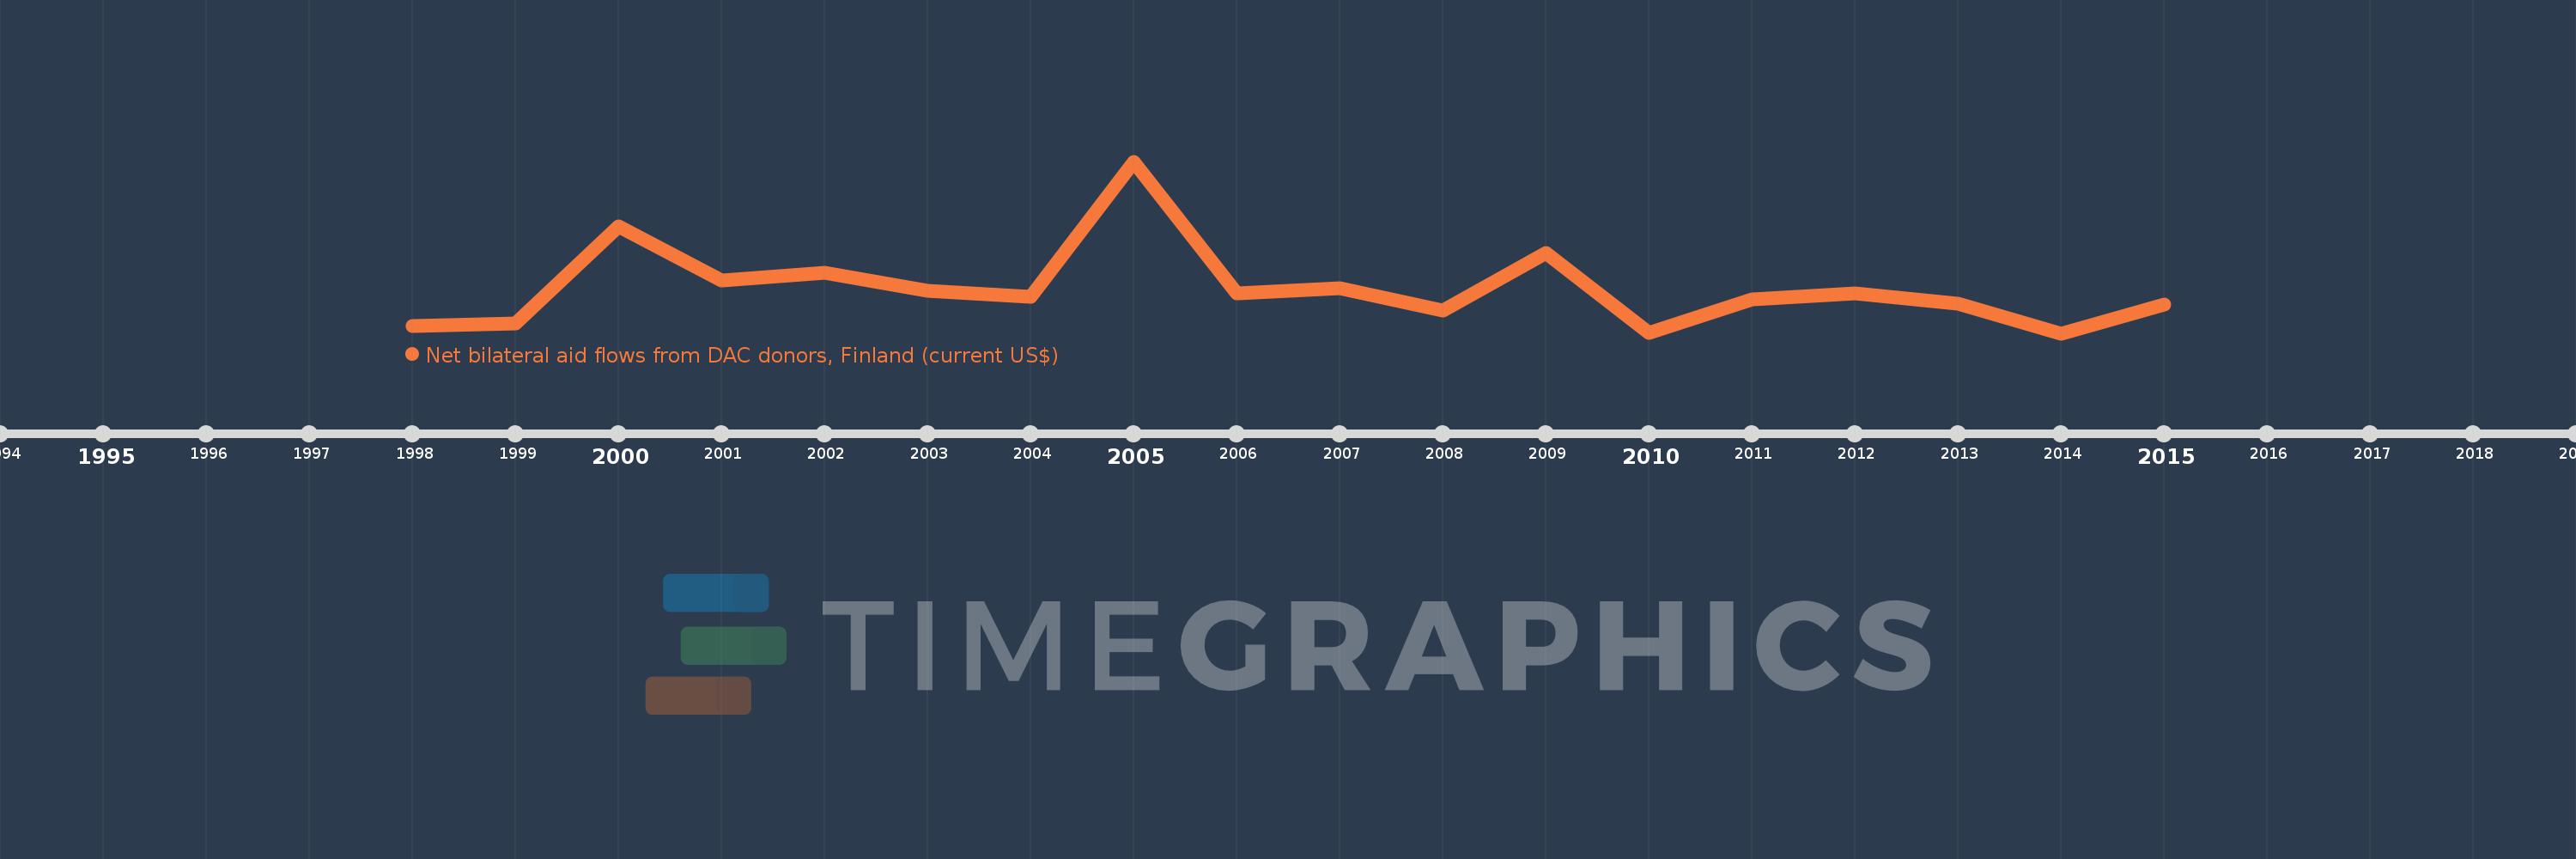
This timeline shows a graph from 1998 to 2015 of Serbia. No data until 1997. Number of actual observations by date: 18.
Source name:
World Development Indicators
Source organization:
Development Assistance Committee of the Organisation for Economic Co-operation and Development, Geographical Distribution of Financial Flows to Developing Countries, Development Co-operation Report, and International Development Statistics database. Data are available online at: www.oecd.org/dac/stats/idsonline.
Categories, topics:
Aid Effectiveness
Last updated:
apr 23, 2017
Indicators value changes by year
Meaning:
9.541 mln
Minimum:
210.0K
jan 1, 2014
Maximum:
35.87 mln
jan 1, 2005
At the date of observation
Value
Absolute change
Change from the previous value
jan 1, 1998
1.72 mln
+1.72 mln
0.0%
jan 1, 1999
2.28 mln
+560.0K
32.56%
jan 1, 2000
22.39 mln
+20.11 mln
882.02%
jan 1, 2001
11.26 mln
-11.13 mln
-49.71%
jan 1, 2002
12.8 mln
+1.54 mln
13.68%
jan 1, 2003
8.97 mln
-3.83 mln
-29.92%
jan 1, 2004
7.86 mln
-1.11 mln
-12.37%
jan 1, 2005
35.87 mln
+28.01 mln
356.36%
jan 1, 2006
8.59 mln
-27.28 mln
-76.05%
jan 1, 2007
9.54 mln
+950.0K
11.06%
jan 1, 2008
4.93 mln
-4.61 mln
-48.32%
jan 1, 2009
16.81 mln
+11.88 mln
240.97%
jan 1, 2010
320.0K
-16.49 mln
-98.1%
jan 1, 2011
7.33 mln
+7.01 mln
2.19K%
jan 1, 2012
8.42 mln
+1.09 mln
14.87%
jan 1, 2013
6.28 mln
-2.14 mln
-25.42%
jan 1, 2014
210.0K
-6.07 mln
-96.66%
jan 1, 2015
6.15 mln
+5.94 mln
2.83K%
Ranking of countries by current statistics by years