33
/
AIzaSyB4mHJ5NPEv-XzF7P6NDYXjlkCWaeKw5bc
November 30, 2025
284949
Yemen, Rep.
YEM
true
2
1
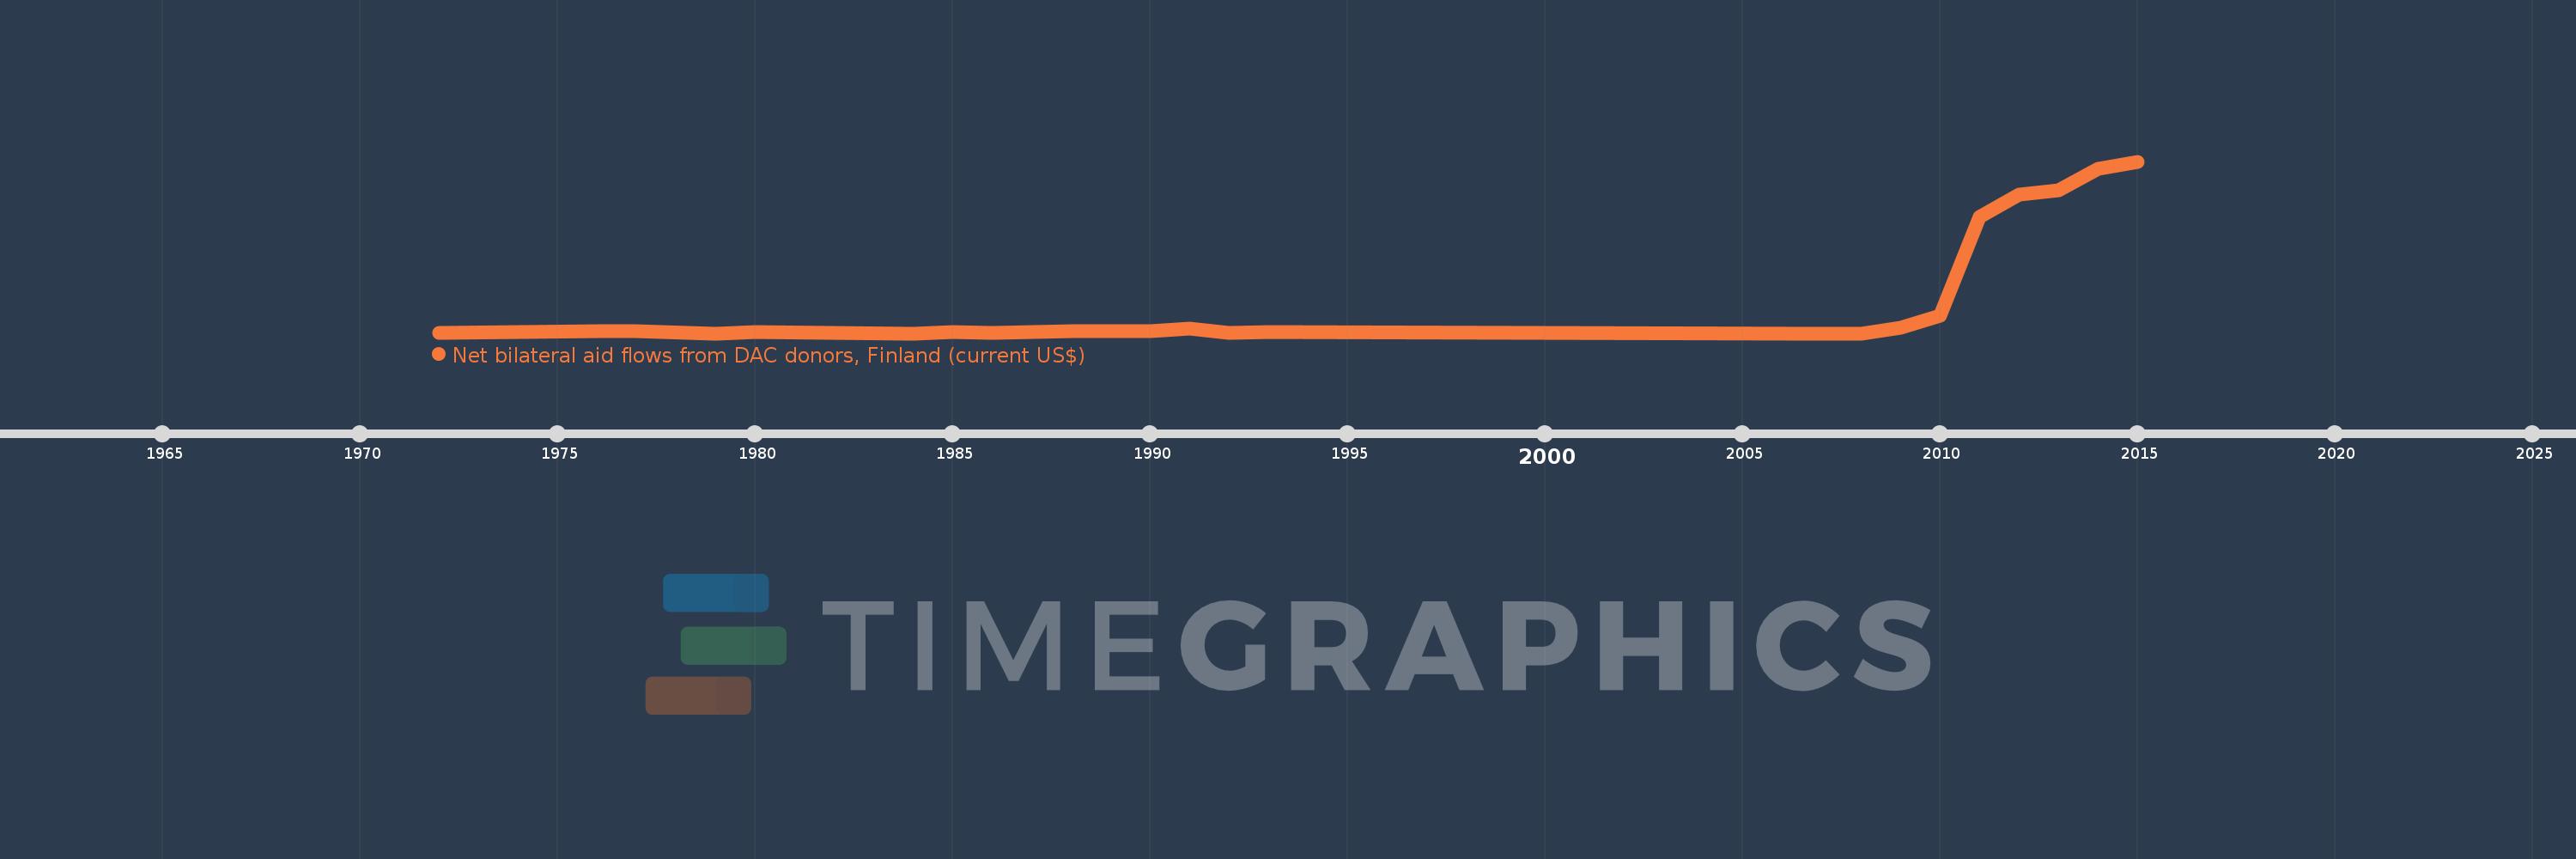
Net bilateral aid flows from DAC donors, Finland (current US$)
2015,2014,2013,2012,2011,2010,2009,2008,2007,1993,1992,1991,1990,1989,1988,1987,1986,1985,1984,1980,1979,1977,1976,1972