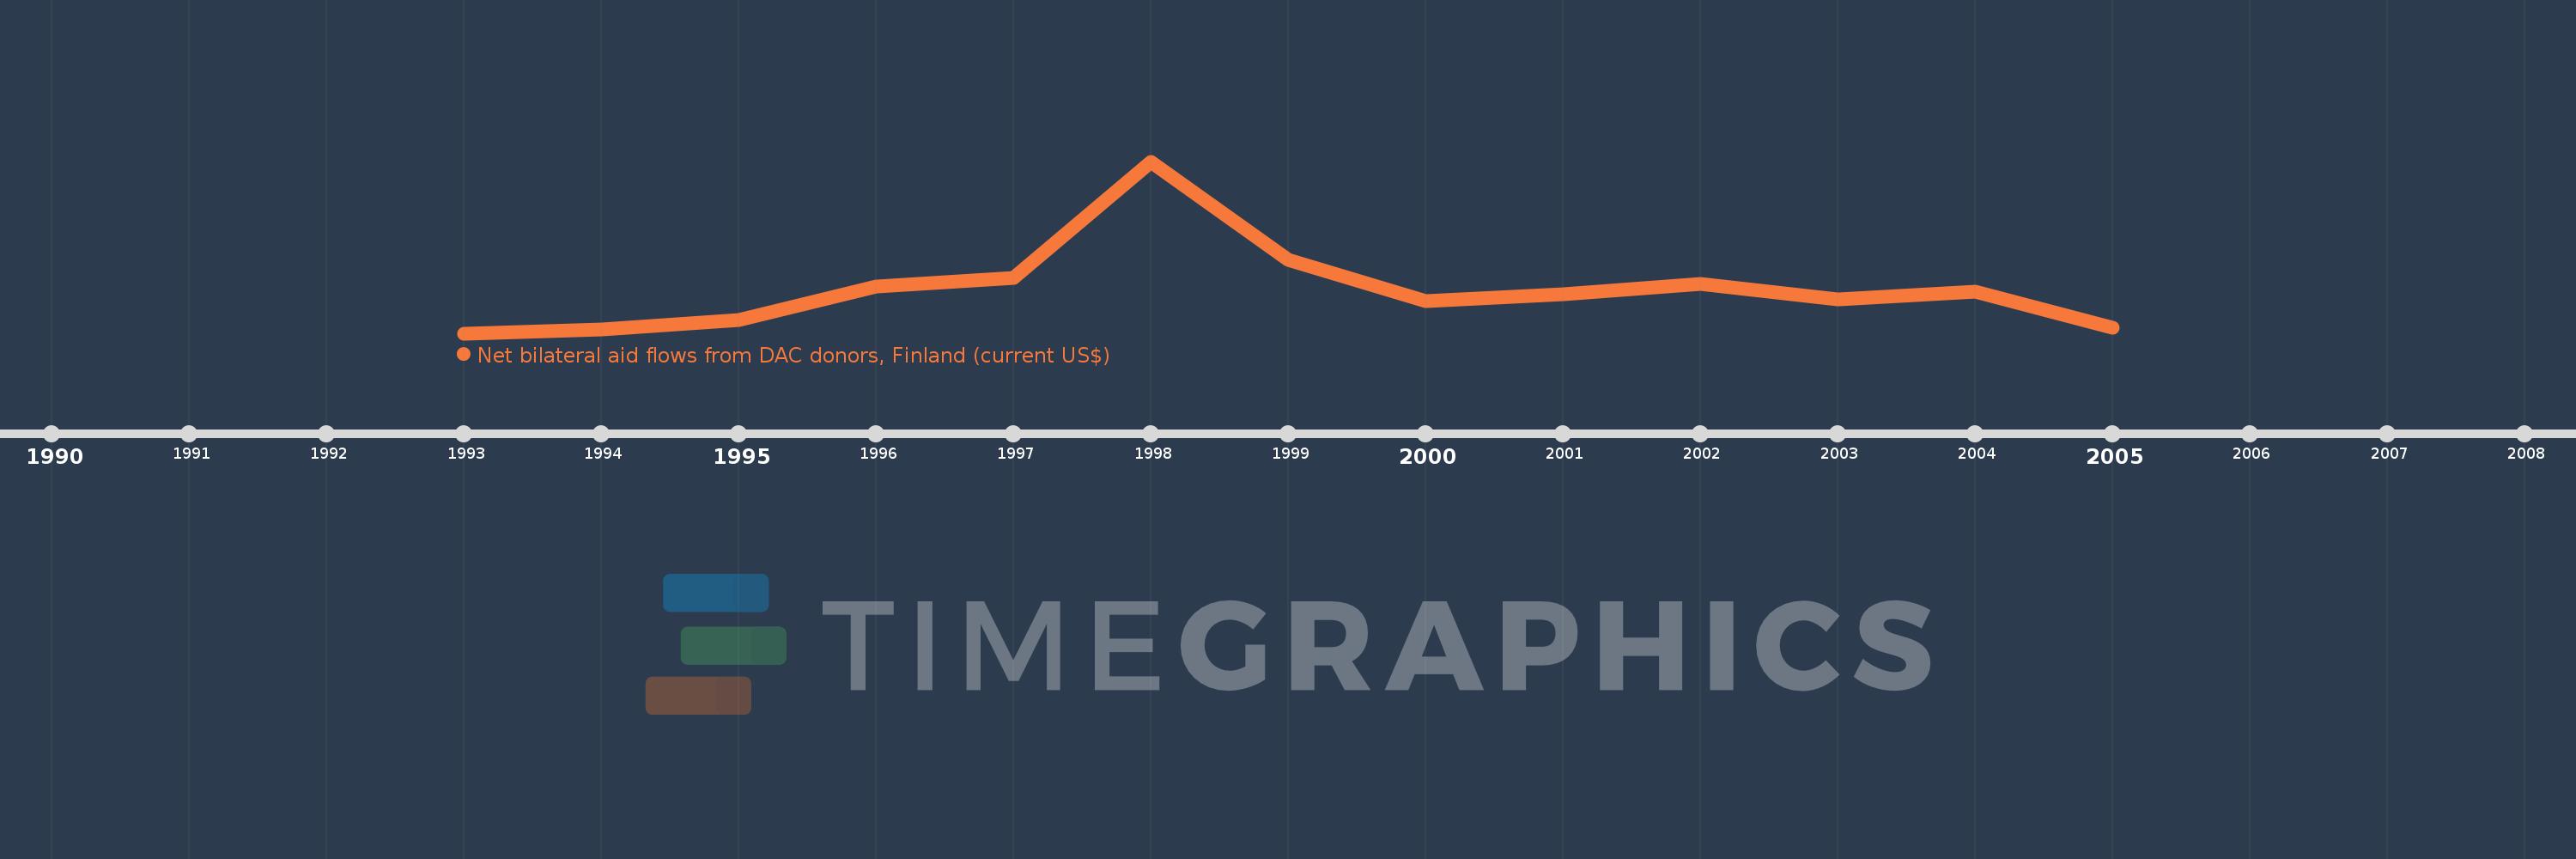
This timeline shows a graph from 1993 to 2005 of Latvia. No data until 1992. Number of actual observations by date: 13.
Source name:
World Development Indicators
Source organization:
Development Assistance Committee of the Organisation for Economic Co-operation and Development, Geographical Distribution of Financial Flows to Developing Countries, Development Co-operation Report, and International Development Statistics database. Data are available online at: www.oecd.org/dac/stats/idsonline.
Categories, topics:
Aid Effectiveness
Last updated:
apr 23, 2017
Indicators value changes by year
Meaning:
2.657 mln
Minimum:
290.0K
jan 1, 1993
Maximum:
9.65 mln
jan 1, 1998
At the date of observation
Value
Absolute change
Change from the previous value
jan 1, 1993
290.0K
+290.0K
0.0%
jan 1, 1994
500.0K
+210.0K
72.41%
jan 1, 1995
1.02 mln
+520.0K
104.0%
jan 1, 1996
2.84 mln
+1.82 mln
178.43%
jan 1, 1997
3.3 mln
+460.0K
16.2%
jan 1, 1998
9.65 mln
+6.35 mln
192.42%
jan 1, 1999
4.27 mln
-5.38 mln
-55.75%
jan 1, 2000
2.05 mln
-2.22 mln
-51.99%
jan 1, 2001
2.41 mln
+360.0K
17.56%
jan 1, 2002
2.97 mln
+560.0K
23.24%
jan 1, 2003
2.12 mln
-850.0K
-28.62%
jan 1, 2004
2.54 mln
+420.0K
19.81%
jan 1, 2005
580.0K
-1.96 mln
-77.17%
Ranking of countries by current statistics by years