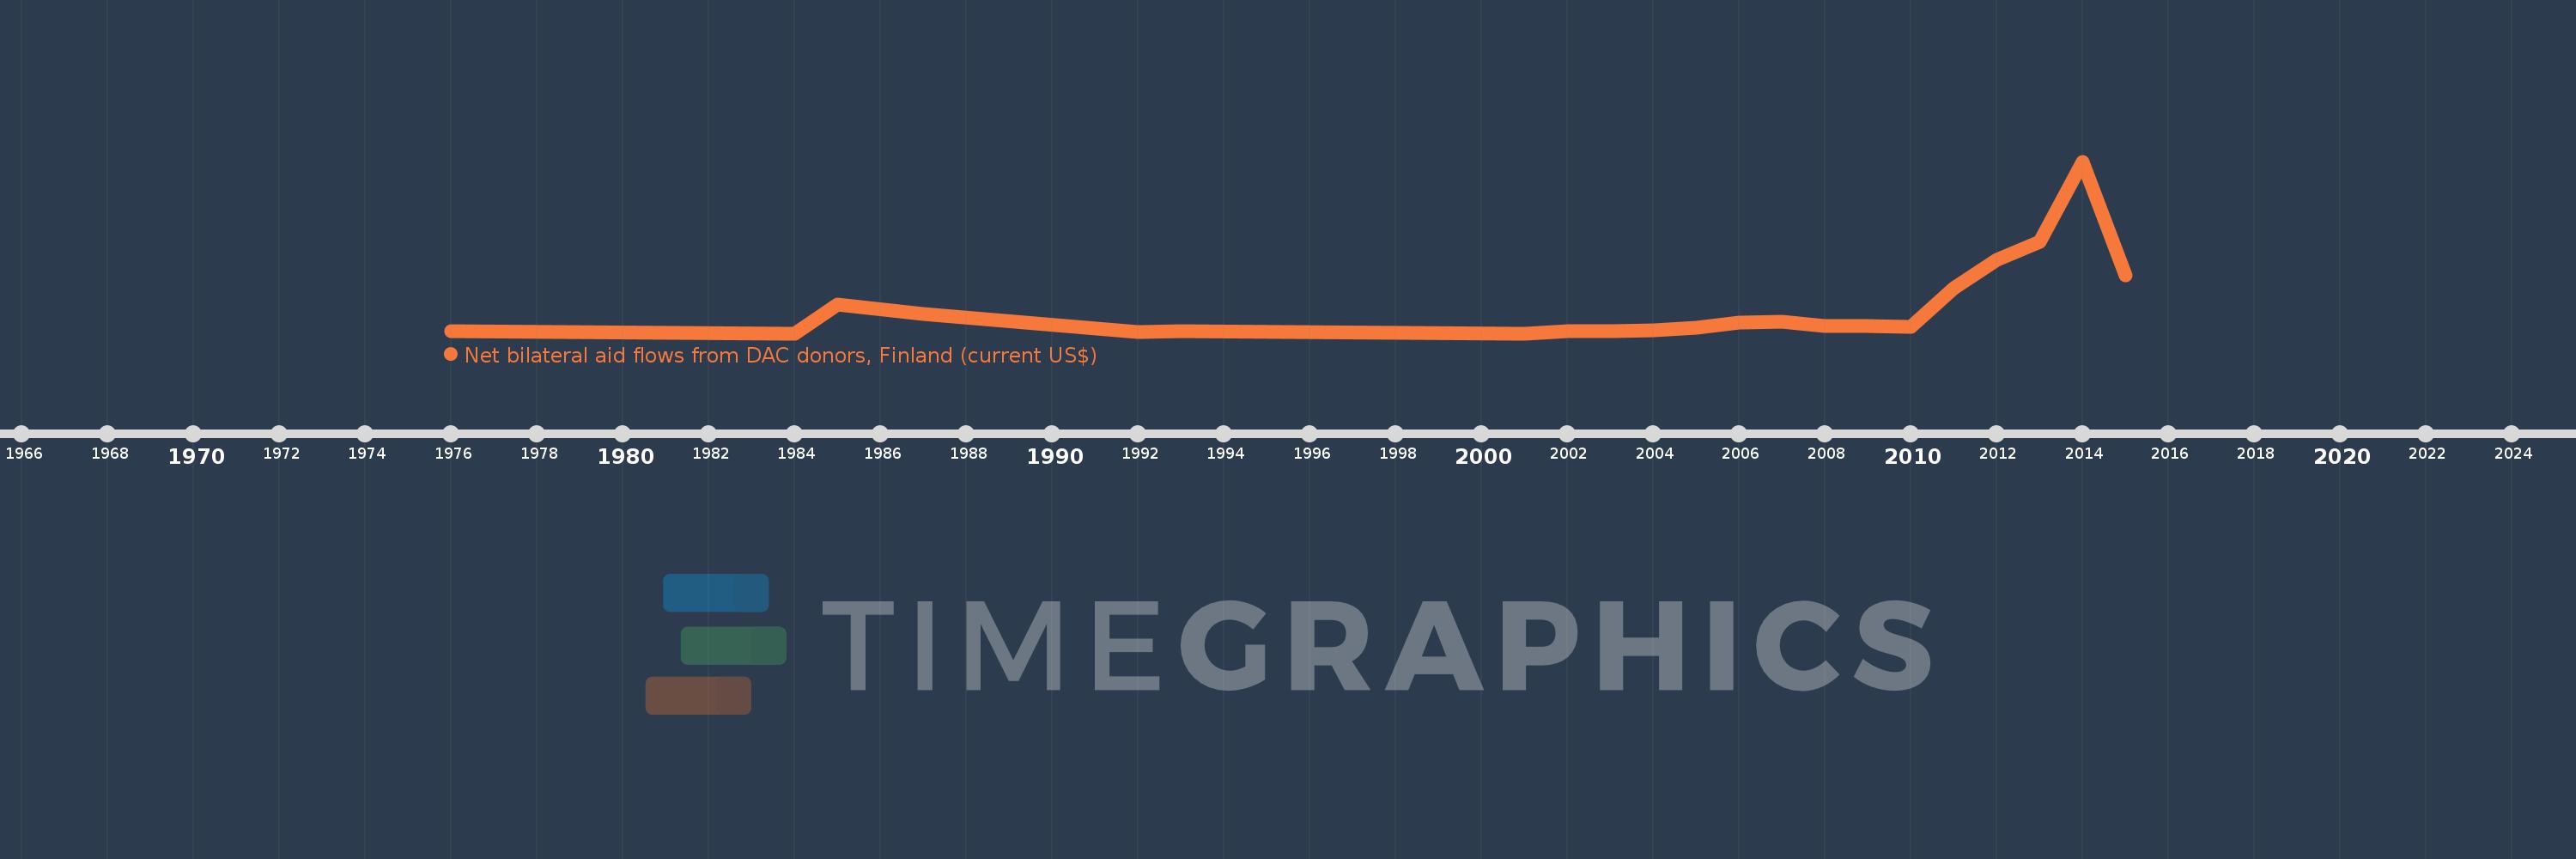
This timeline shows a graph from 1976 to 2015 of Mali. No data until 1975. Number of actual observations by date: 21.
Source name:
World Development Indicators
Source organization:
Development Assistance Committee of the Organisation for Economic Co-operation and Development, Geographical Distribution of Financial Flows to Developing Countries, Development Co-operation Report, and International Development Statistics database. Data are available online at: www.oecd.org/dac/stats/idsonline.
Categories, topics:
Aid Effectiveness
Last updated:
apr 23, 2017
Indicators value changes by year
Meaning:
423.81K
Minimum:
10.0K
jan 1, 1984
Maximum:
2.73 mln
jan 1, 2014
At the date of observation
Value
Absolute change
Change from the previous value
jan 1, 1976
40.0K
+40.0K
0.0%
jan 1, 1984
10.0K
-30.0K
-75.0%
jan 1, 1985
460.0K
+450.0K
4.5K%
jan 1, 1987
310.0K
-150.0K
-32.61%
jan 1, 1992
30.0K
-280.0K
-90.32%
jan 1, 1993
40.0K
+10.0K
33.33%
jan 1, 2001
10.0K
-30.0K
-75.0%
jan 1, 2002
40.0K
+30.0K
300.0%
jan 1, 2003
50.0K
+10.0K
25.0%
jan 1, 2004
60.0K
+10.0K
20.0%
jan 1, 2005
100.0K
+40.0K
66.67%
jan 1, 2006
180.0K
+80.0K
80.0%
jan 1, 2007
190.0K
+10.0K
5.56%
jan 1, 2008
130.0K
-60.0K
-31.58%
jan 1, 2009
120.0K
-10.0K
-7.69%
jan 1, 2010
110.0K
-10.0K
-8.33%
jan 1, 2011
730.0K
+620.0K
563.64%
jan 1, 2012
1.17 mln
+440.0K
60.27%
jan 1, 2013
1.46 mln
+290.0K
24.79%
jan 1, 2014
2.73 mln
+1.27 mln
86.99%
jan 1, 2015
930.0K
-1.8 mln
-65.93%
Ranking of countries by current statistics by years