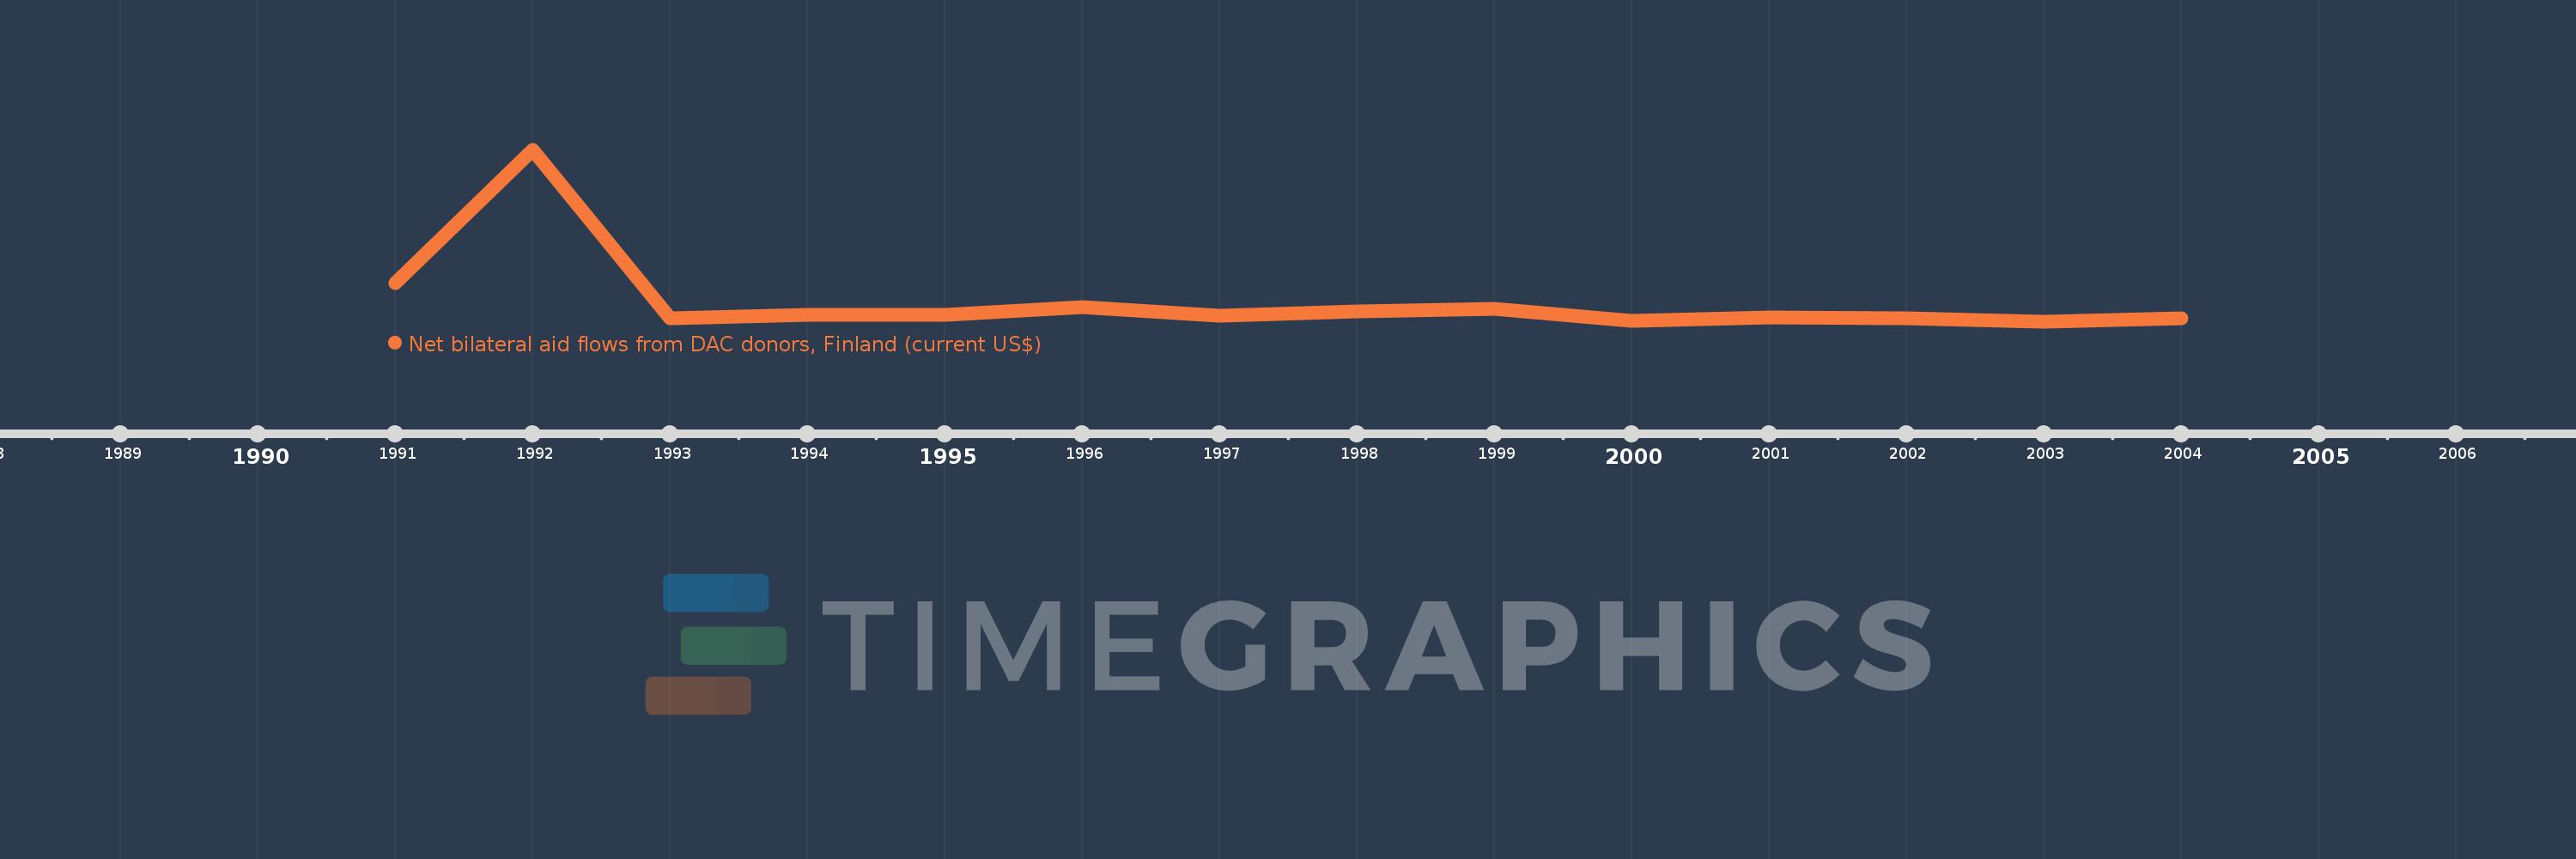
This timeline shows a graph from 1991 to 2004 of Poland. No data until 1990. Number of actual observations by date: 14.
Source name:
World Development Indicators
Source organization:
Development Assistance Committee of the Organisation for Economic Co-operation and Development, Geographical Distribution of Financial Flows to Developing Countries, Development Co-operation Report, and International Development Statistics database. Data are available online at: www.oecd.org/dac/stats/idsonline.
Categories, topics:
Aid Effectiveness
Last updated:
apr 23, 2017
Indicators value changes by year
Meaning:
6.784 mln
Minimum:
-1.42 mln
jan 1, 2003
Maximum:
67.09 mln
jan 1, 1992
At the date of observation
Value
Absolute change
Change from the previous value
jan 1, 1991
14.26 mln
+14.26 mln
0.0%
jan 1, 1992
67.09 mln
+52.83 mln
370.48%
jan 1, 1993
110.0K
-66.98 mln
-99.84%
jan 1, 1994
1.36 mln
+1.25 mln
1.14K%
jan 1, 1995
1.57 mln
+210.0K
15.44%
jan 1, 1996
4.55 mln
+2.98 mln
189.81%
jan 1, 1997
1.25 mln
-3.3 mln
-72.53%
jan 1, 1998
2.83 mln
+1.58 mln
126.4%
jan 1, 1999
3.85 mln
+1.02 mln
36.04%
jan 1, 2000
-920.0K
-4.77 mln
-123.9%
jan 1, 2001
270.0K
+1.19 mln
-129.35%
jan 1, 2002
50.0K
-220.0K
-81.48%
jan 1, 2003
-1.42 mln
-1.47 mln
-2.94K%
jan 1, 2004
130.0K
+1.55 mln
-109.15%
Ranking of countries by current statistics by years