33
/
AIzaSyB4mHJ5NPEv-XzF7P6NDYXjlkCWaeKw5bc
November 30, 2025
177950
Lesotho
LSO
true
2
1
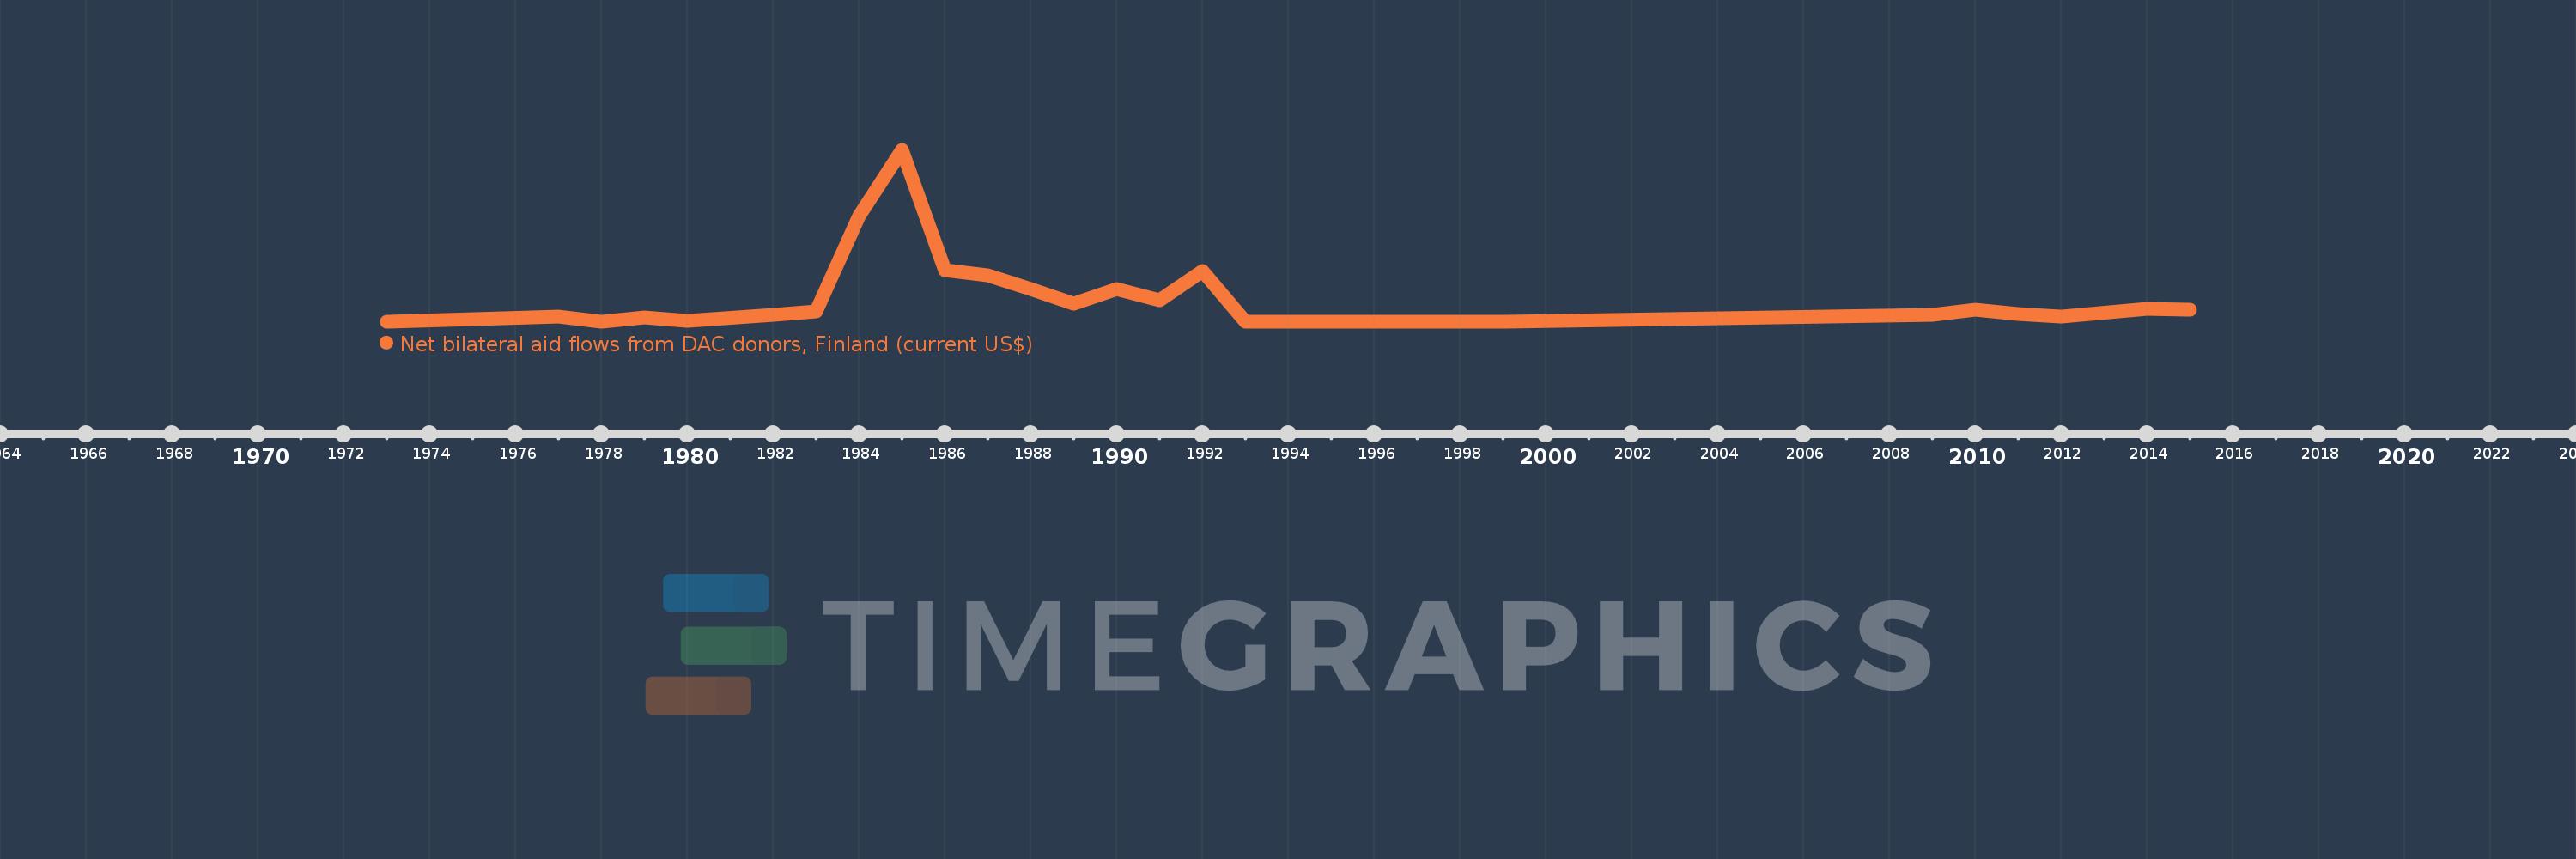
Net bilateral aid flows from DAC donors, Finland (current US$)
2015,2014,2012,2011,2010,2009,1999,1998,1993,1992,1991,1990,1989,1988,1987,1986,1985,1984,1983,1982,1980,1979,1978,1977,1973