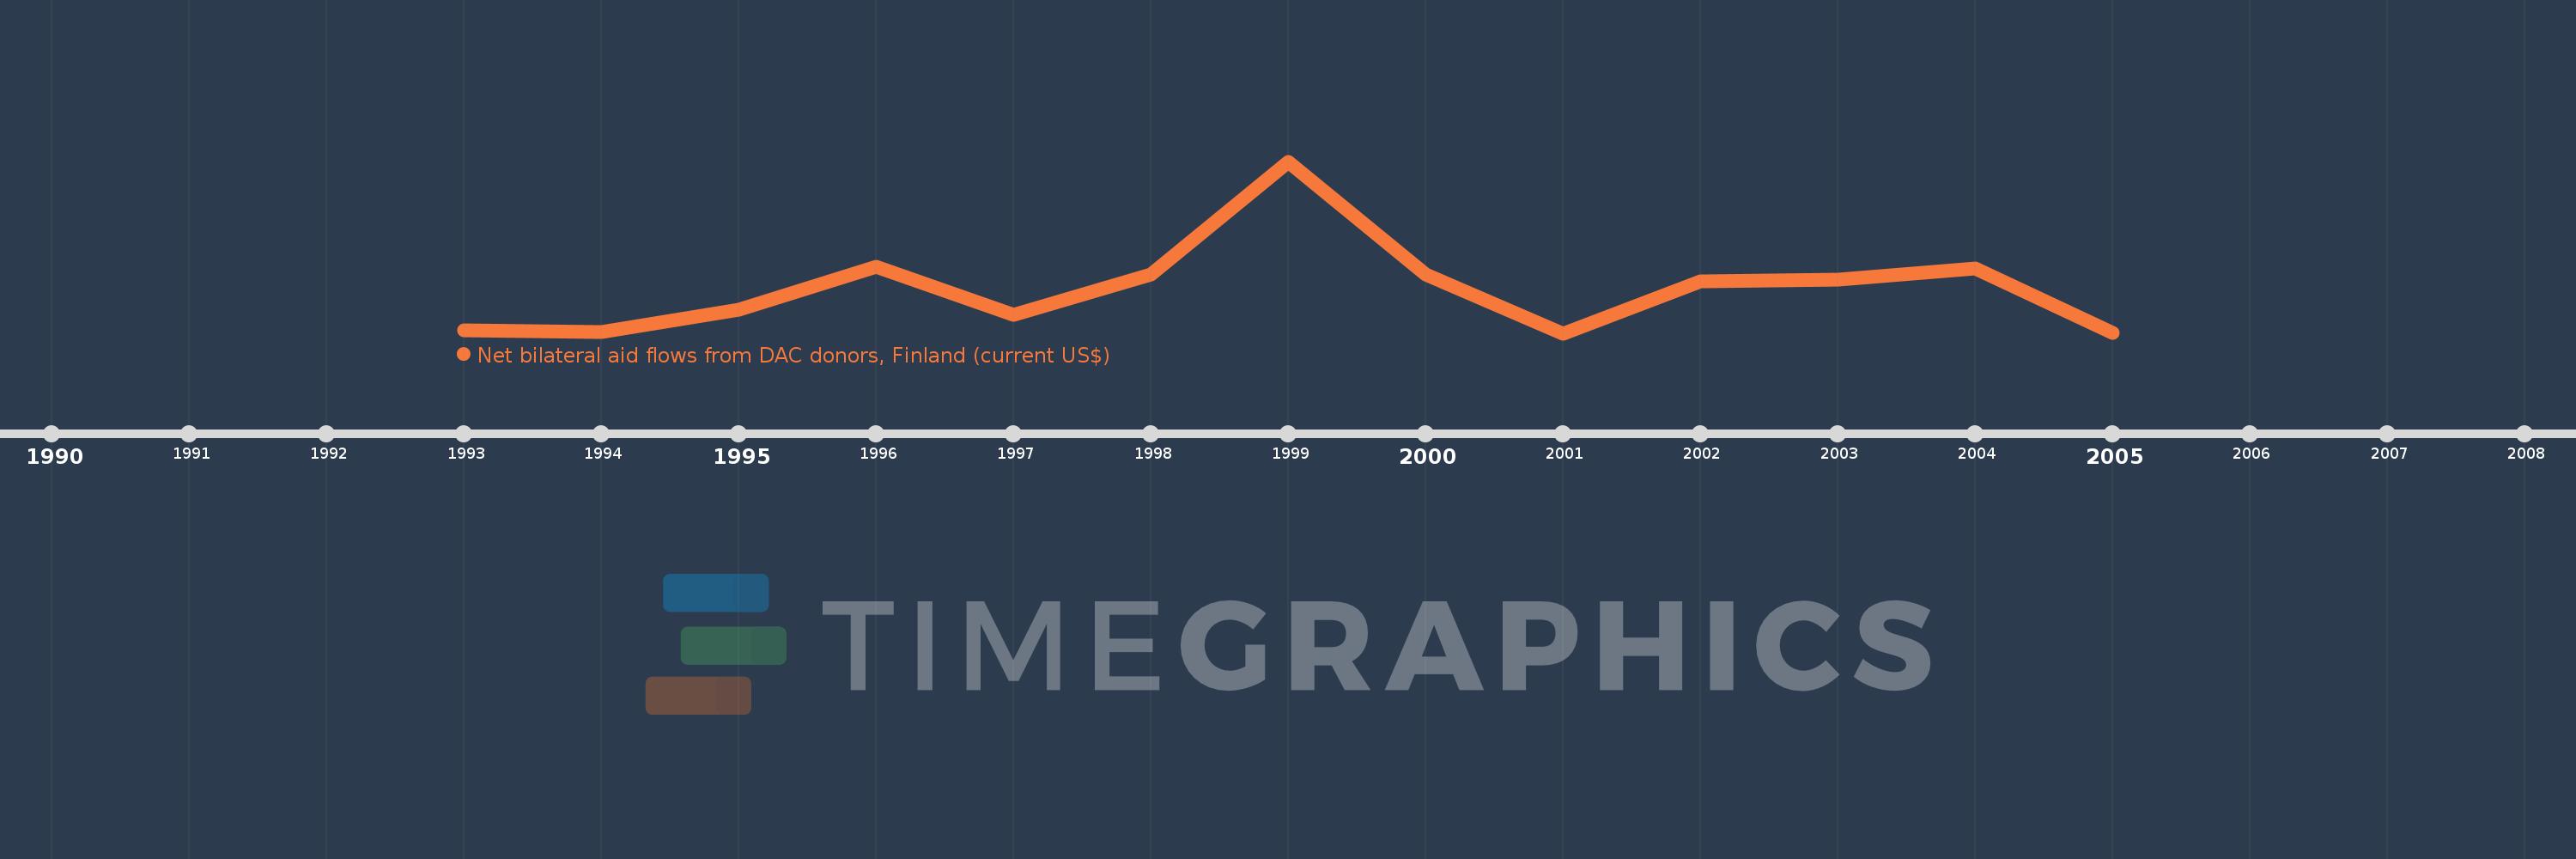
This timeline shows a graph from 1993 to 2005 of Lithuania. No data until 1992. Number of actual observations by date: 13.
Source name:
World Development Indicators
Source organization:
Development Assistance Committee of the Organisation for Economic Co-operation and Development, Geographical Distribution of Financial Flows to Developing Countries, Development Co-operation Report, and International Development Statistics database. Data are available online at: www.oecd.org/dac/stats/idsonline.
Categories, topics:
Aid Effectiveness
Last updated:
apr 23, 2017
Indicators value changes by year
Meaning:
1.631 mln
Minimum:
120.0K
jan 1, 2001
Maximum:
6.01 mln
jan 1, 1999
At the date of observation
Value
Absolute change
Change from the previous value
jan 1, 1993
210.0K
+210.0K
0.0%
jan 1, 1994
170.0K
-40.0K
-19.05%
jan 1, 1995
920.0K
+750.0K
441.18%
jan 1, 1996
2.4 mln
+1.48 mln
160.87%
jan 1, 1997
750.0K
-1.65 mln
-68.75%
jan 1, 1998
2.14 mln
+1.39 mln
185.33%
jan 1, 1999
6.01 mln
+3.87 mln
180.84%
jan 1, 2000
2.14 mln
-3.87 mln
-64.39%
jan 1, 2001
120.0K
-2.02 mln
-94.39%
jan 1, 2002
1.89 mln
+1.77 mln
1.48K%
jan 1, 2003
1.96 mln
+70.0K
3.7%
jan 1, 2004
2.35 mln
+390.0K
19.9%
jan 1, 2005
140.0K
-2.21 mln
-94.04%
Ranking of countries by current statistics by years