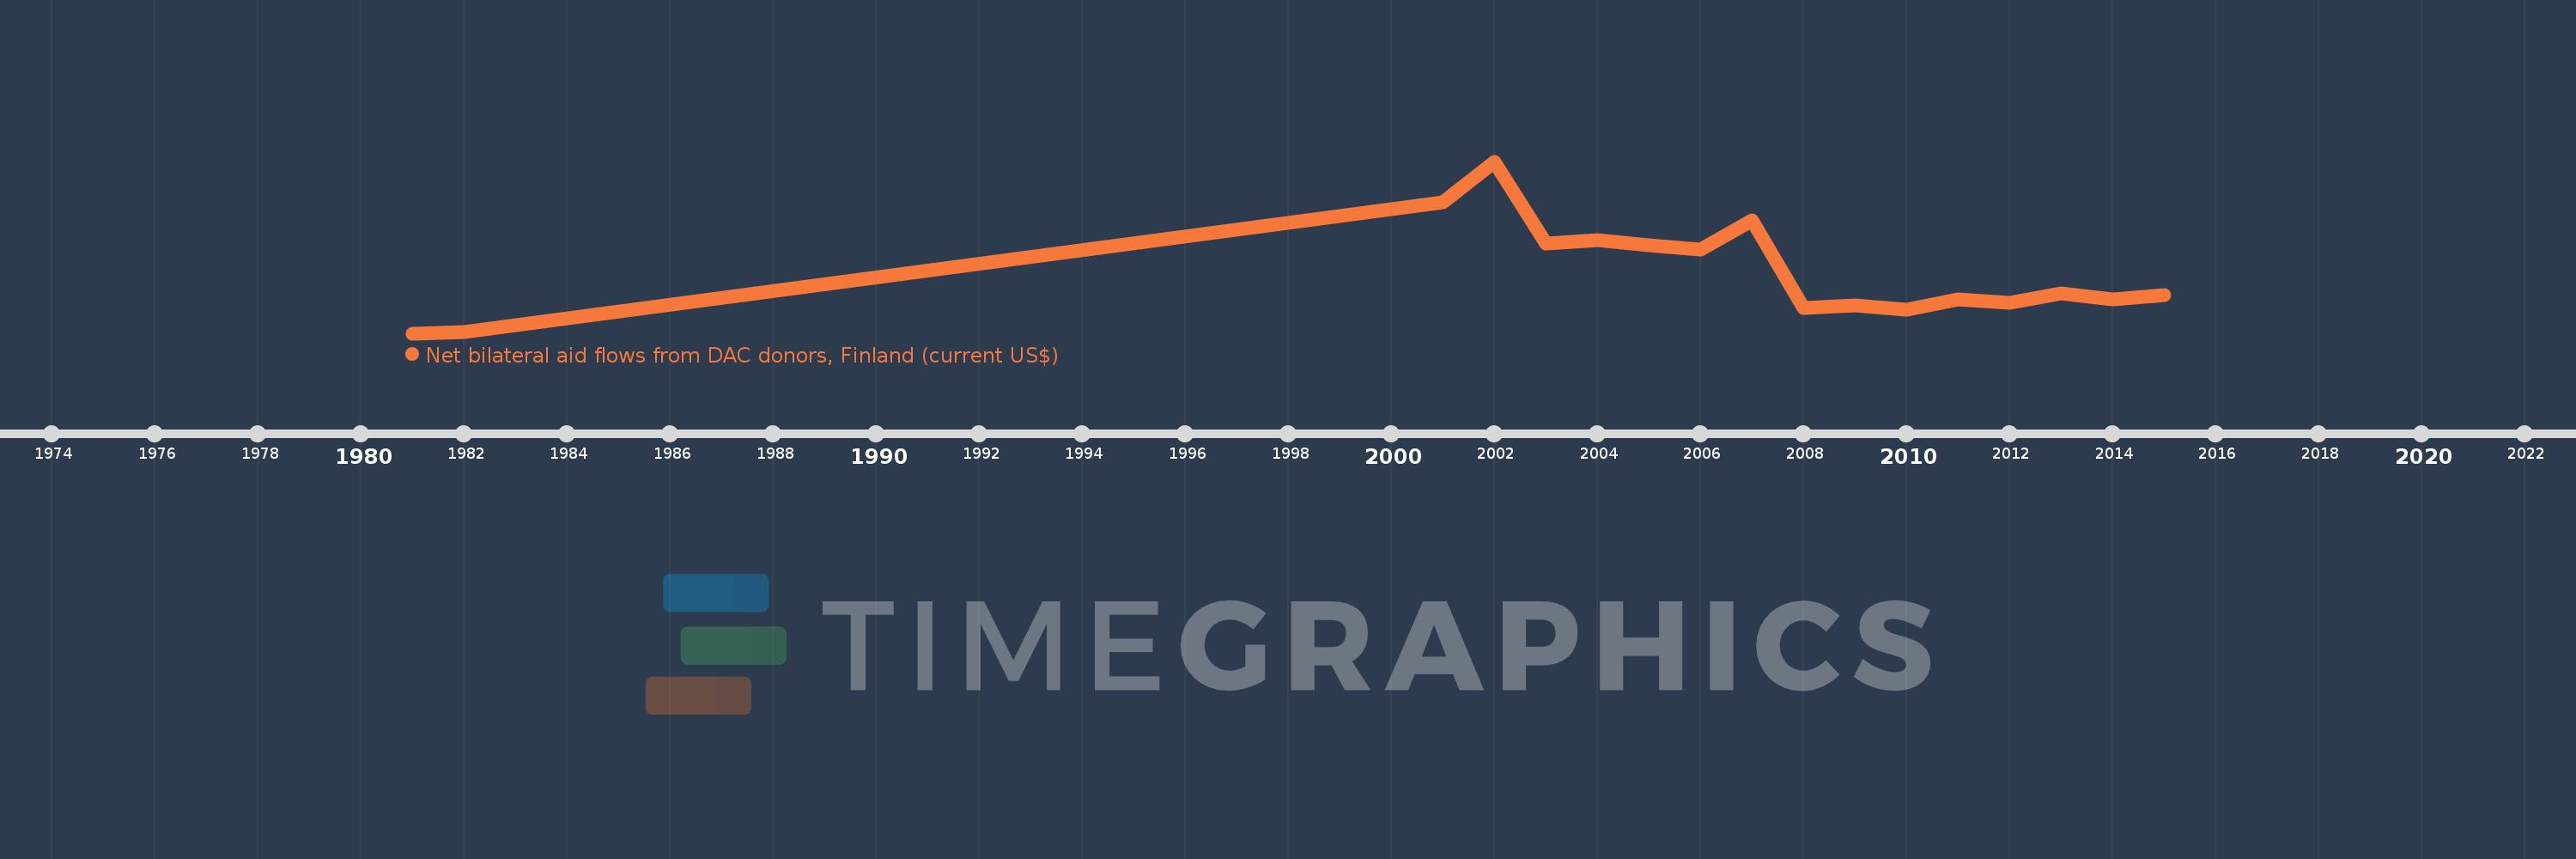
This timeline shows a graph from 1981 to 2015 of Timor-Leste. No data until 1980. Number of actual observations by date: 17.
Source name:
World Development Indicators
Source organization:
Development Assistance Committee of the Organisation for Economic Co-operation and Development, Geographical Distribution of Financial Flows to Developing Countries, Development Co-operation Report, and International Development Statistics database. Data are available online at: www.oecd.org/dac/stats/idsonline.
Categories, topics:
Aid Effectiveness
Last updated:
apr 23, 2017
Indicators value changes by year
Meaning:
1.288 mln
Minimum:
30.0K
jan 1, 1981
Maximum:
3.61 mln
jan 1, 2002
At the date of observation
Value
Absolute change
Change from the previous value
jan 1, 1981
30.0K
+30.0K
0.0%
jan 1, 1982
50.0K
+20.0K
66.67%
jan 1, 2001
2.76 mln
+2.71 mln
5.42K%
jan 1, 2002
3.61 mln
+850.0K
30.8%
jan 1, 2003
1.9 mln
-1.71 mln
-47.37%
jan 1, 2004
1.97 mln
+70.0K
3.68%
jan 1, 2005
1.87 mln
-100.0K
-5.08%
jan 1, 2006
1.78 mln
-90.0K
-4.81%
jan 1, 2007
2.39 mln
+610.0K
34.27%
jan 1, 2008
560.0K
-1.83 mln
-76.57%
jan 1, 2009
620.0K
+60.0K
10.71%
jan 1, 2010
520.0K
-100.0K
-16.13%
jan 1, 2011
730.0K
+210.0K
40.38%
jan 1, 2012
670.0K
-60.0K
-8.22%
jan 1, 2013
870.0K
+200.0K
29.85%
jan 1, 2014
730.0K
-140.0K
-16.09%
jan 1, 2015
830.0K
+100.0K
13.7%
Ranking of countries by current statistics by years