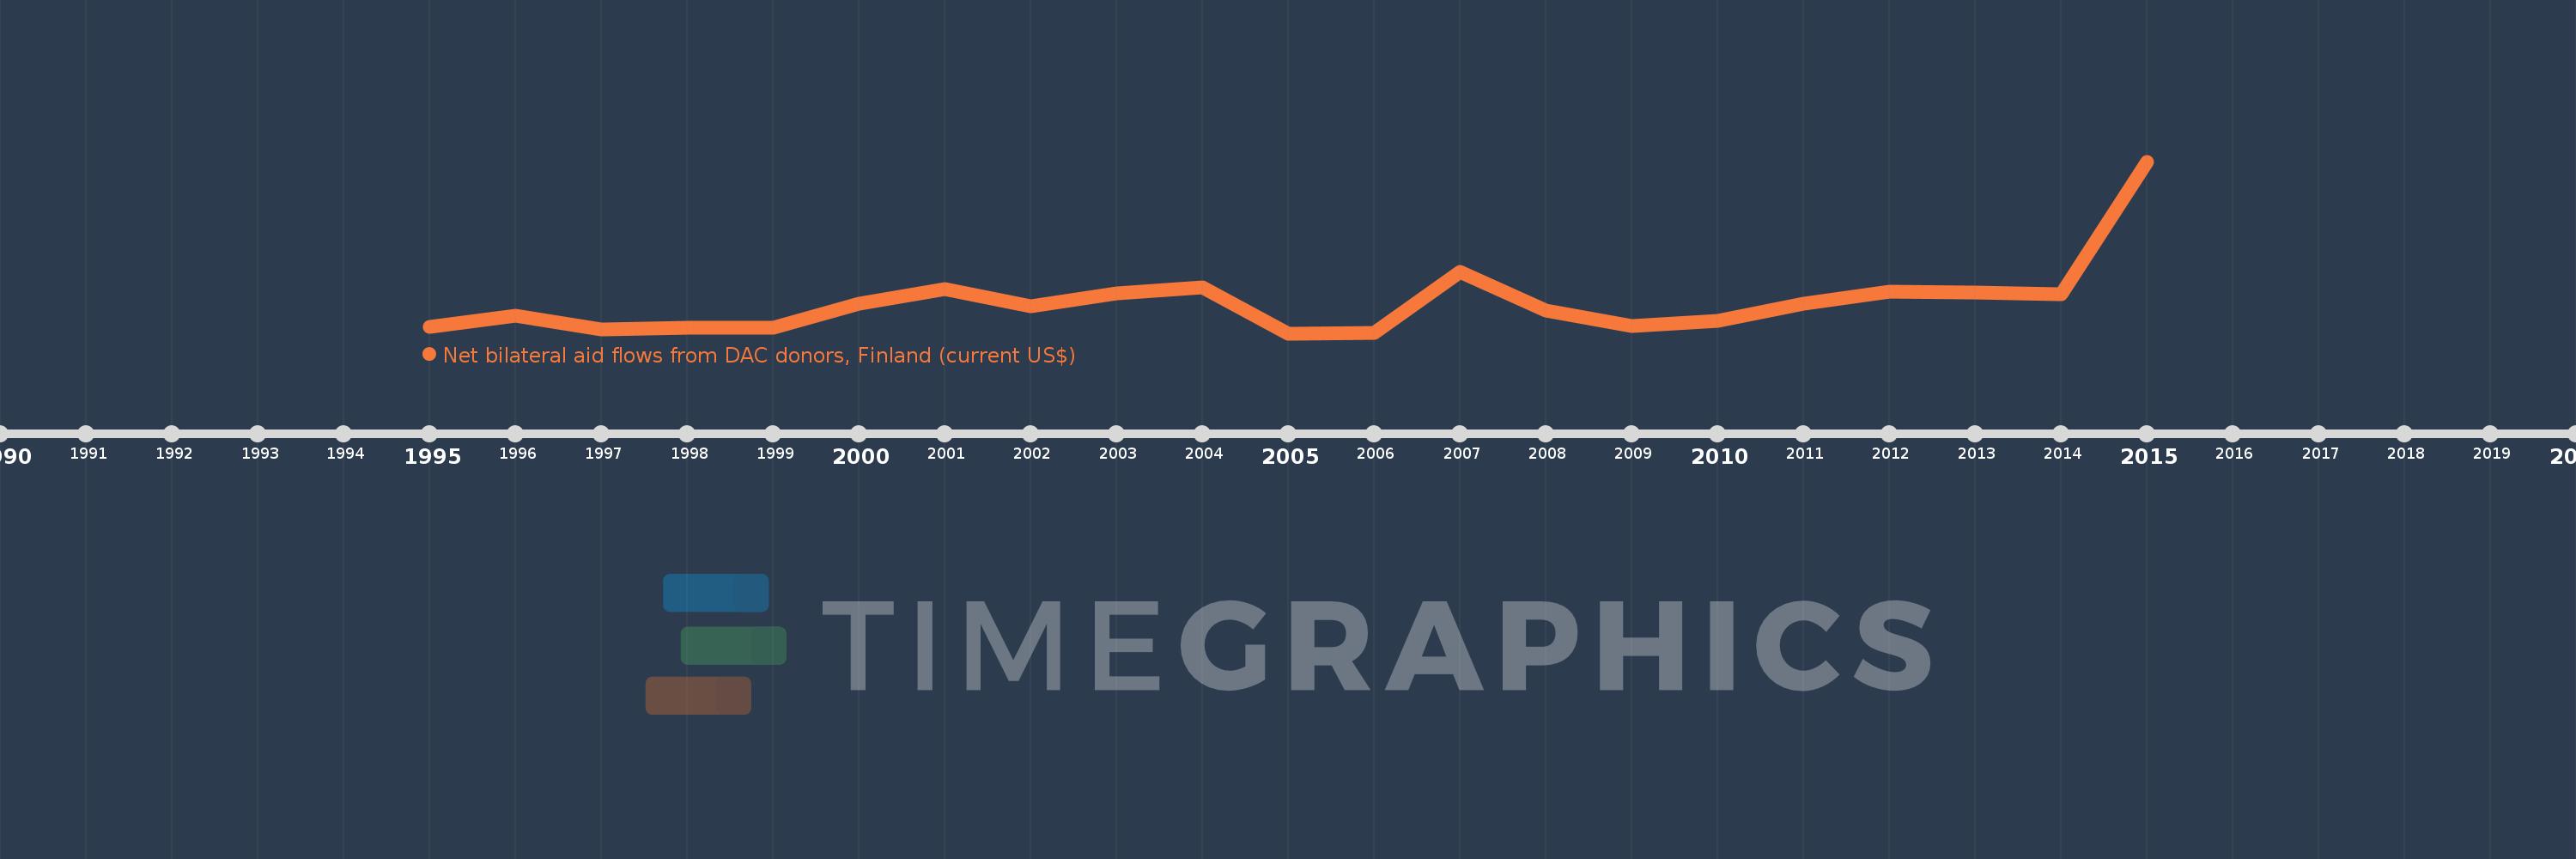
This timeline shows a graph from 1995 to 2015 of Ukraine. No data until 1994. Number of actual observations by date: 21.
Source name:
World Development Indicators
Source organization:
Development Assistance Committee of the Organisation for Economic Co-operation and Development, Geographical Distribution of Financial Flows to Developing Countries, Development Co-operation Report, and International Development Statistics database. Data are available online at: www.oecd.org/dac/stats/idsonline.
Categories, topics:
Aid Effectiveness
Last updated:
apr 23, 2017
Indicators value changes by year
Meaning:
1.261 mln
Minimum:
30.0K
jan 1, 2005
Maximum:
6.84 mln
jan 1, 2015
At the date of observation
Value
Absolute change
Change from the previous value
jan 1, 1995
280.0K
+280.0K
0.0%
jan 1, 1996
730.0K
+450.0K
160.71%
jan 1, 1997
190.0K
-540.0K
-73.97%
jan 1, 1998
250.0K
+60.0K
31.58%
jan 1, 1999
250.0K
0.0
0.0%
jan 1, 2000
1.2 mln
+950.0K
380.0%
jan 1, 2001
1.77 mln
+570.0K
47.5%
jan 1, 2002
1.09 mln
-680.0K
-38.42%
jan 1, 2003
1.63 mln
+540.0K
49.54%
jan 1, 2004
1.84 mln
+210.0K
12.88%
jan 1, 2005
30.0K
-1.81 mln
-98.37%
jan 1, 2006
50.0K
+20.0K
66.67%
jan 1, 2007
2.47 mln
+2.42 mln
4.84K%
jan 1, 2008
930.0K
-1.54 mln
-62.35%
jan 1, 2009
320.0K
-610.0K
-65.59%
jan 1, 2010
520.0K
+200.0K
62.5%
jan 1, 2011
1.19 mln
+670.0K
128.85%
jan 1, 2012
1.67 mln
+480.0K
40.34%
jan 1, 2013
1.66 mln
-10.0K
-0.6%
jan 1, 2014
1.57 mln
-90.0K
-5.42%
jan 1, 2015
6.84 mln
+5.27 mln
335.67%
Ranking of countries by current statistics by years