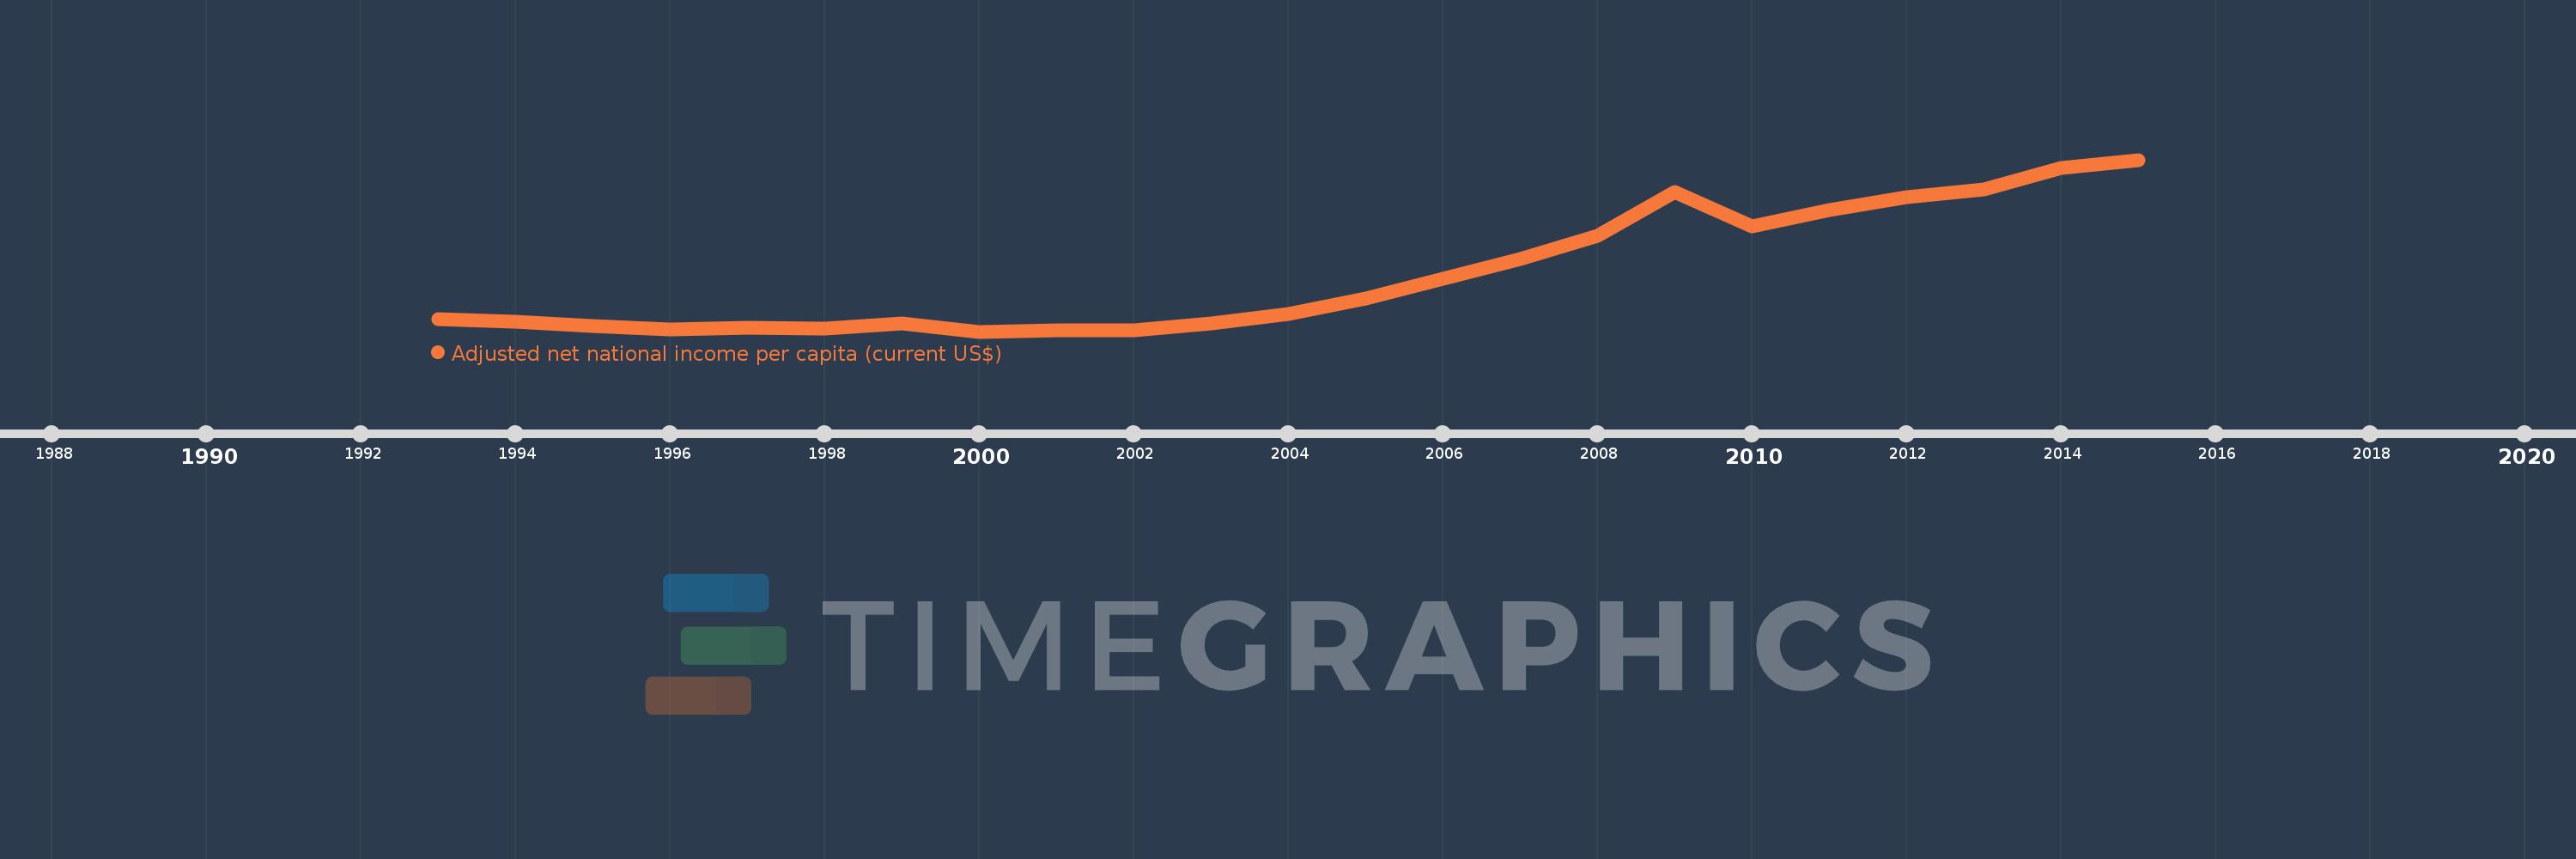
This timeline shows a graph from 1993 to 2015 of Belarus. No data until 1992. Number of actual observations by date: 23.
Source name:
World Development Indicators
Source organization:
World Bank staff estimates based on sources and methods in World Bank's "The Changing Wealth of Nations: Measuring Sustainable Development in the New Millennium" (2011).
Categories, topics:
Economy & Growth
Last updated:
apr 23, 2017
Indicators value changes by year
Meaning:
2.931K
Minimum:
1.042K
jan 1, 2000
Maximum:
6.758K
jan 1, 2015
At the date of observation
Value
Absolute change
Change from the previous value
jan 1, 1993
1.461K
+1.461K
0.0%
jan 1, 1994
1.372K
-89.141
-6.1%
jan 1, 1995
1.228K
-144.462
-10.53%
jan 1, 1996
1.122K
-105.702
-8.61%
jan 1, 1997
1.181K
+58.587
5.22%
jan 1, 1998
1.155K
-25.965
-2.2%
jan 1, 1999
1.3K
+145.031
12.56%
jan 1, 2000
1.042K
-257.848
-19.84%
jan 1, 2001
1.094K
+52.312
5.02%
jan 1, 2002
1.081K
-13.557
-1.24%
jan 1, 2003
1.3K
+219.722
20.33%
jan 1, 2004
1.617K
+316.632
24.35%
jan 1, 2005
2.132K
+514.572
31.82%
jan 1, 2006
2.81K
+678.761
31.84%
jan 1, 2007
3.458K
+647.191
23.03%
jan 1, 2008
4.233K
+775.65
22.43%
jan 1, 2009
5.681K
+1.448K
34.21%
jan 1, 2010
4.53K
-1.152K
-20.27%
jan 1, 2011
5.085K
+555.334
12.26%
jan 1, 2012
5.529K
+443.697
8.73%
jan 1, 2013
5.759K
+229.912
4.16%
jan 1, 2014
6.487K
+728.507
12.65%
jan 1, 2015
6.758K
+271.405
4.18%
Ranking of countries by current statistics by years