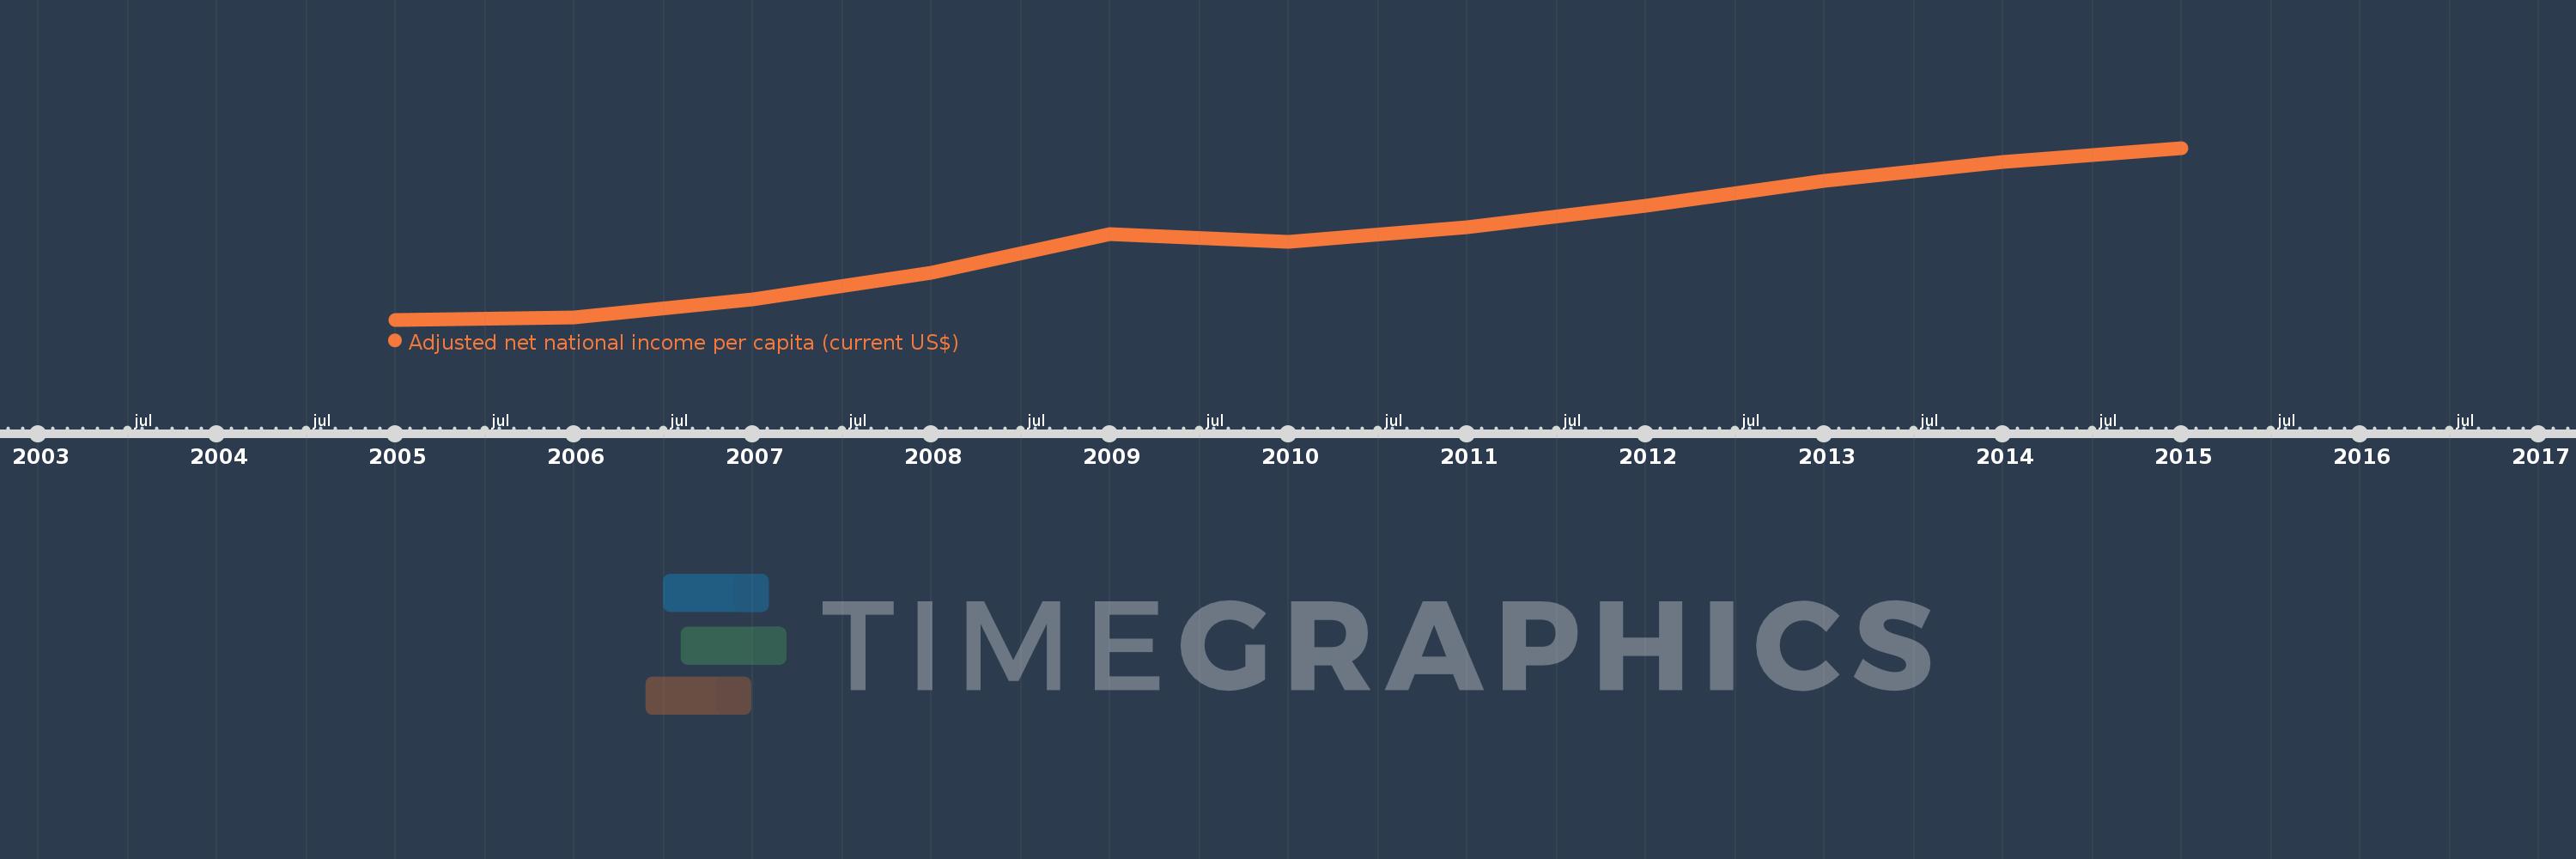
This timeline shows a graph from 2005 to 2015 of Tajikistan. No data until 2004. Number of actual observations by date: 11.
Source name:
World Development Indicators
Source organization:
World Bank staff estimates based on sources and methods in World Bank's "The Changing Wealth of Nations: Measuring Sustainable Development in the New Millennium" (2011).
Categories, topics:
Economy & Growth
Last updated:
apr 23, 2017
Indicators value changes by year
Meaning:
629.054
Minimum:
242.146
jan 1, 2005
Maximum:
1.046K
jan 1, 2015
At the date of observation
Value
Absolute change
Change from the previous value
jan 1, 2005
242.146
+242.146
0.0%
jan 1, 2006
252.099
+9.953
4.11%
jan 1, 2007
337.671
+85.572
33.94%
jan 1, 2008
463.202
+125.531
37.18%
jan 1, 2009
643.551
+180.349
38.94%
jan 1, 2010
608.441
-35.11
-5.46%
jan 1, 2011
676.722
+68.28
11.22%
jan 1, 2012
775.159
+98.438
14.55%
jan 1, 2013
892.601
+117.442
15.15%
jan 1, 2014
981.883
+89.282
10.0%
jan 1, 2015
1.046K
+64.242
6.54%
Ranking of countries by current statistics by years