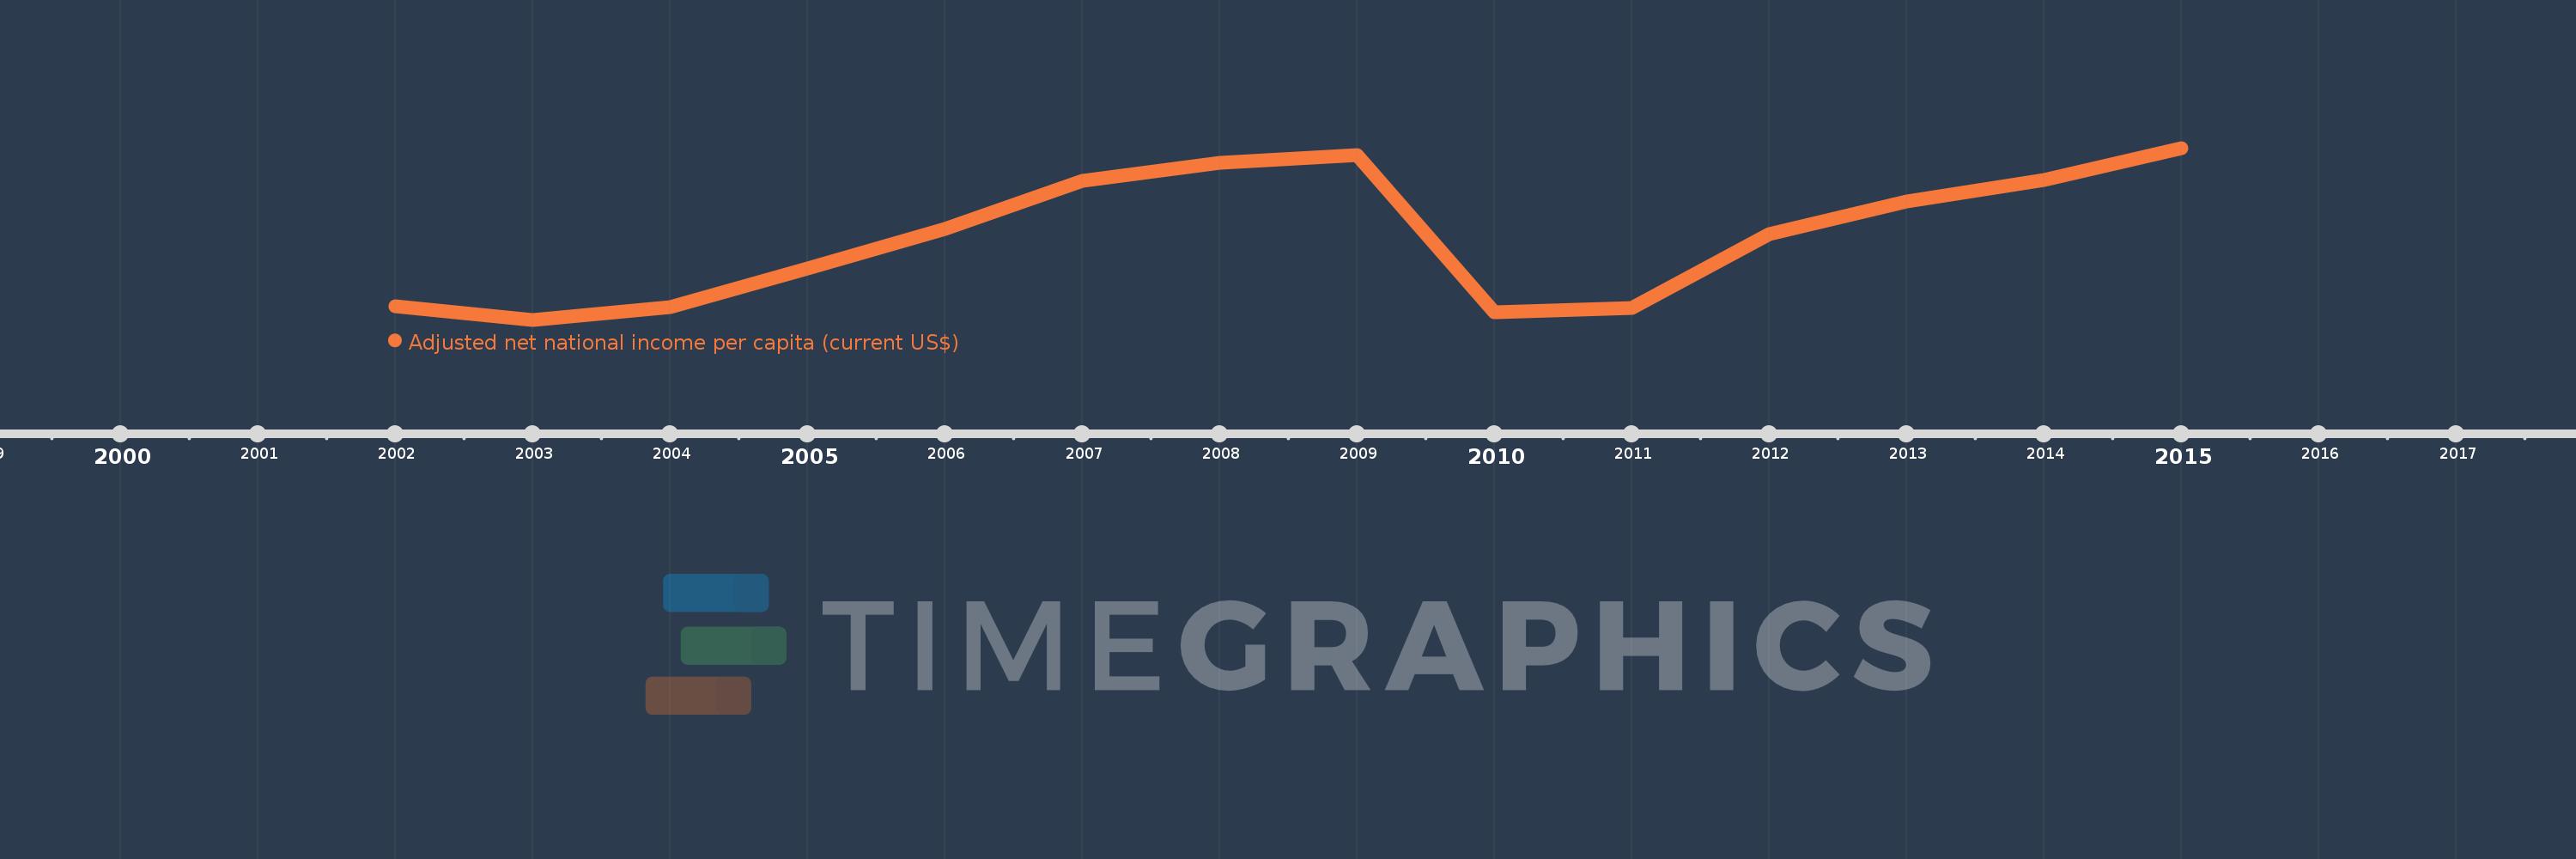
This timeline shows a graph from 2002 to 2015 of United Arab Emirates. No data until 2001. Number of actual observations by date: 14.
Source name:
World Development Indicators
Source organization:
World Bank staff estimates based on sources and methods in World Bank's "The Changing Wealth of Nations: Measuring Sustainable Development in the New Millennium" (2011).
Categories, topics:
Economy & Growth
Last updated:
apr 23, 2017
Indicators value changes by year
Meaning:
29.68K
Minimum:
25.55K
jan 1, 2003
Maximum:
34.087K
jan 1, 2015
At the date of observation
Value
Absolute change
Change from the previous value
jan 1, 2002
26.233K
+26.233K
0.0%
jan 1, 2003
25.55K
-683.05
-2.6%
jan 1, 2004
26.167K
+617.197
2.42%
jan 1, 2005
28.082K
+1.916K
7.32%
jan 1, 2006
30.061K
+1.979K
7.05%
jan 1, 2007
32.471K
+2.41K
8.02%
jan 1, 2008
33.346K
+874.781
2.69%
jan 1, 2009
33.741K
+394.671
1.18%
jan 1, 2010
25.907K
-7.834K
-23.22%
jan 1, 2011
26.15K
+243.194
0.94%
jan 1, 2012
29.796K
+3.646K
13.94%
jan 1, 2013
31.421K
+1.625K
5.46%
jan 1, 2014
32.507K
+1.086K
3.46%
jan 1, 2015
34.087K
+1.58K
4.86%
Ranking of countries by current statistics by years