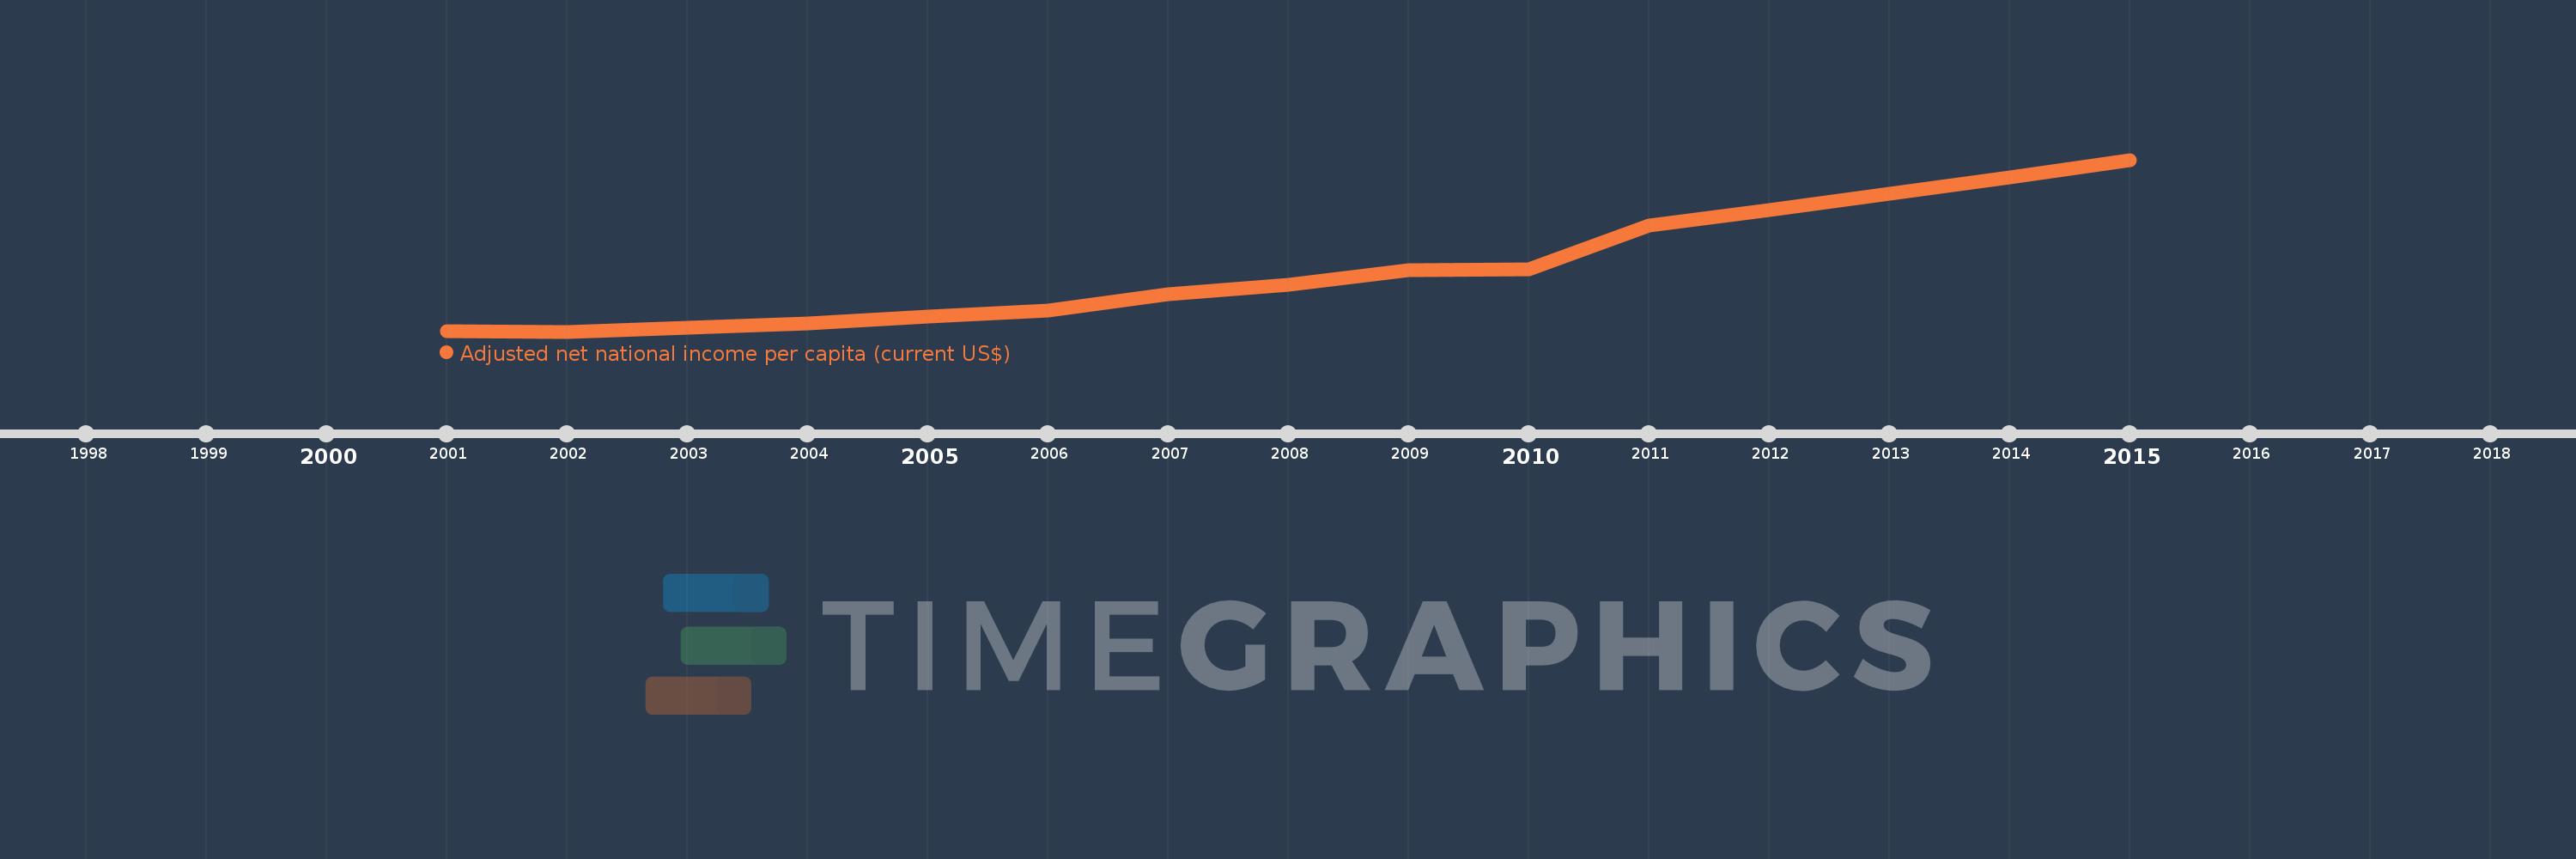
This timeline shows a graph from 2001 to 2015 of IDA blend. No data until 2000. Number of actual observations by date: 15.
Source name:
World Development Indicators
Source organization:
World Bank staff estimates based on sources and methods in World Bank's "The Changing Wealth of Nations: Measuring Sustainable Development in the New Millennium" (2011).
Categories, topics:
Economy & Growth
Last updated:
apr 23, 2017
Indicators value changes by year
Meaning:
944.193
Minimum:
376.829
jan 1, 2002
Maximum:
1.916K
jan 1, 2015
At the date of observation
Value
Absolute change
Change from the previous value
jan 1, 2001
383.479
+383.479
0.0%
jan 1, 2002
376.829
-6.65
-1.73%
jan 1, 2003
413.116
+36.287
9.63%
jan 1, 2004
450.557
+37.442
9.06%
jan 1, 2005
513.673
+63.116
14.01%
jan 1, 2006
565.605
+51.932
10.11%
jan 1, 2007
711.763
+146.158
25.84%
jan 1, 2008
799.365
+87.603
12.31%
jan 1, 2009
925.398
+126.033
15.77%
jan 1, 2010
938.242
+12.844
1.39%
jan 1, 2011
1.324K
+385.385
41.08%
jan 1, 2012
1.469K
+145.315
10.98%
jan 1, 2013
1.615K
+145.852
9.93%
jan 1, 2014
1.762K
+147.012
9.1%
jan 1, 2015
1.916K
+153.894
8.74%
Ranking of countries by current statistics by years