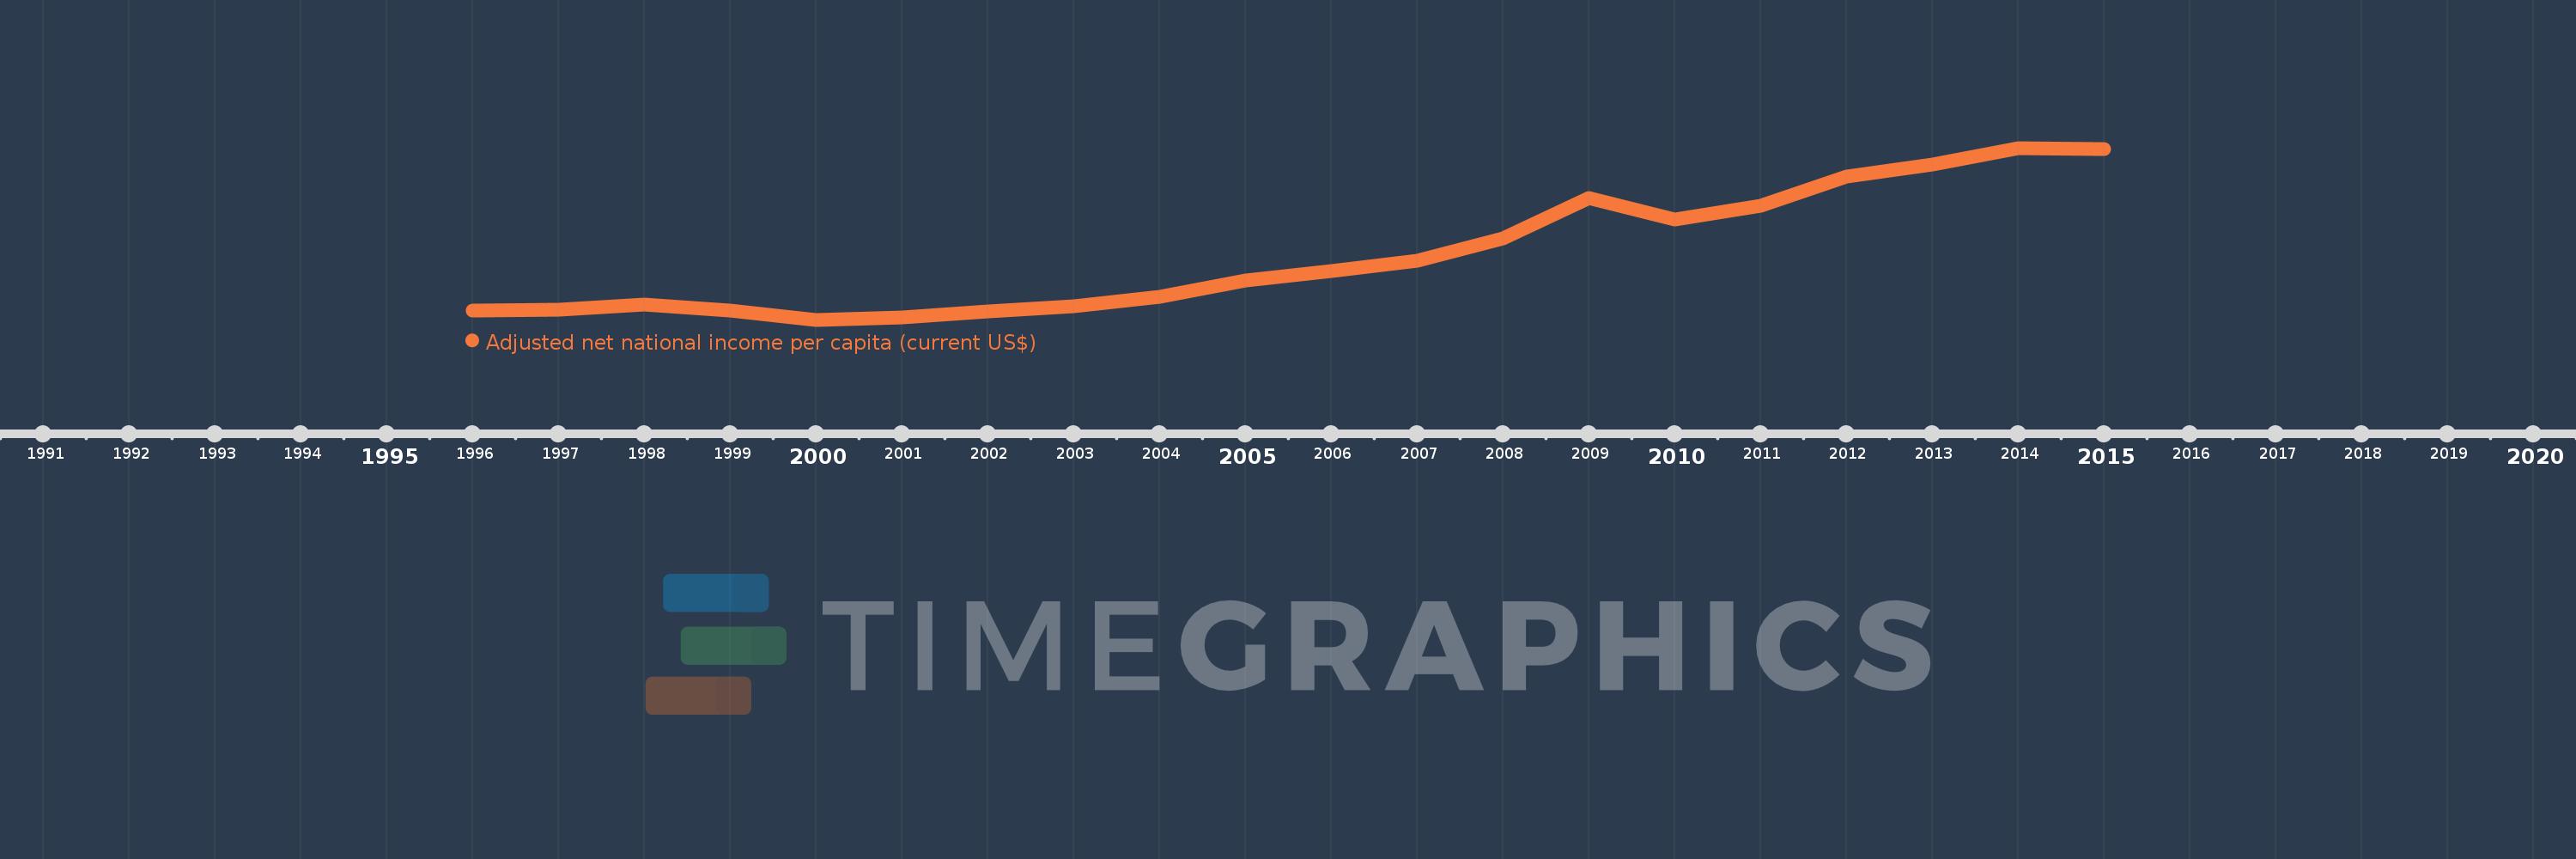
This timeline shows a graph from 1996 to 2015 of Moldova. No data until 1995. Number of actual observations by date: 20.
Source name:
World Development Indicators
Source organization:
World Bank staff estimates based on sources and methods in World Bank's "The Changing Wealth of Nations: Measuring Sustainable Development in the New Millennium" (2011).
Categories, topics:
Economy & Growth
Last updated:
apr 23, 2017
Indicators value changes by year
Meaning:
1.02K
Minimum:
259.827
jan 1, 2000
Maximum:
2.273K
jan 1, 2014
At the date of observation
Value
Absolute change
Change from the previous value
jan 1, 1996
369.403
+369.403
0.0%
jan 1, 1997
379.598
+10.196
2.76%
jan 1, 1998
434.444
+54.846
14.45%
jan 1, 1999
365.748
-68.697
-15.81%
jan 1, 2000
259.827
-105.921
-28.96%
jan 1, 2001
289.823
+29.996
11.54%
jan 1, 2002
361.444
+71.622
24.71%
jan 1, 2003
415.633
+54.189
14.99%
jan 1, 2004
532.75
+117.117
28.18%
jan 1, 2005
718.24
+185.49
34.82%
jan 1, 2006
830.448
+112.208
15.62%
jan 1, 2007
954.727
+124.279
14.97%
jan 1, 2008
1.211K
+256.425
26.86%
jan 1, 2009
1.689K
+477.455
39.42%
jan 1, 2010
1.439K
-249.297
-14.76%
jan 1, 2011
1.599K
+160.016
11.12%
jan 1, 2012
1.94K
+341.051
21.32%
jan 1, 2013
2.08K
+139.316
7.18%
jan 1, 2014
2.273K
+193.462
9.3%
jan 1, 2015
2.259K
-14.009
-0.62%
Ranking of countries by current statistics by years