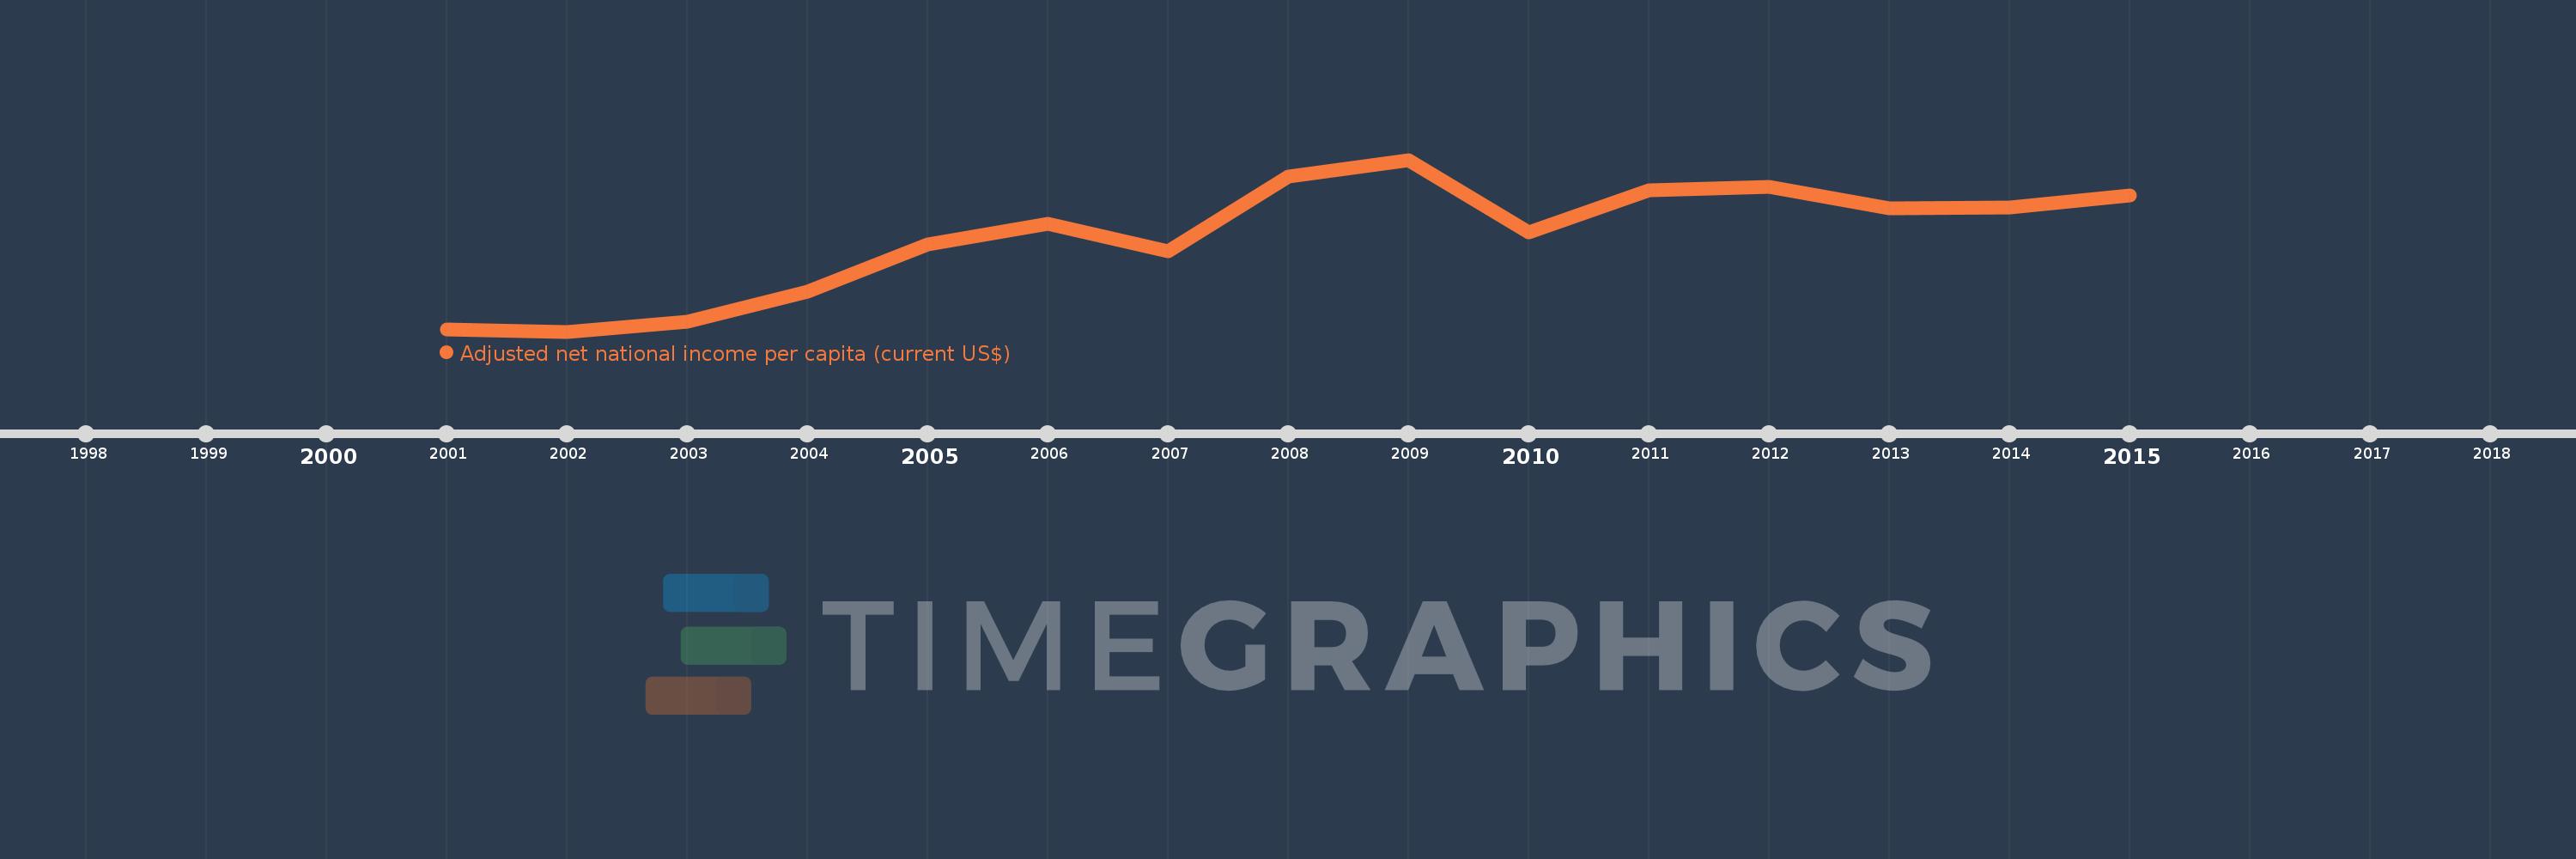
This timeline shows a graph from 2001 to 2015 of Luxembourg. No data until 2000. Number of actual observations by date: 15.
Source name:
World Development Indicators
Source organization:
World Bank staff estimates based on sources and methods in World Bank's "The Changing Wealth of Nations: Measuring Sustainable Development in the New Millennium" (2011).
Categories, topics:
Economy & Growth
Last updated:
apr 23, 2017
Indicators value changes by year
Meaning:
53.399K
Minimum:
32.96K
jan 1, 2002
Maximum:
69.979K
jan 1, 2009
At the date of observation
Value
Absolute change
Change from the previous value
jan 1, 2001
33.405K
+33.405K
0.0%
jan 1, 2002
32.96K
-445.282
-1.33%
jan 1, 2003
35.06K
+2.1K
6.37%
jan 1, 2004
41.633K
+6.573K
18.75%
jan 1, 2005
51.722K
+10.089K
24.23%
jan 1, 2006
56.117K
+4.394K
8.5%
jan 1, 2007
50.301K
-5.815K
-10.36%
jan 1, 2008
66.39K
+16.089K
31.99%
jan 1, 2009
69.979K
+3.588K
5.4%
jan 1, 2010
54.374K
-15.605K
-22.3%
jan 1, 2011
63.334K
+8.96K
16.48%
jan 1, 2012
64.208K
+874.082
1.38%
jan 1, 2013
59.428K
-4.779K
-7.44%
jan 1, 2014
59.782K
+353.79
0.6%
jan 1, 2015
62.283K
+2.501K
4.18%
Ranking of countries by current statistics by years