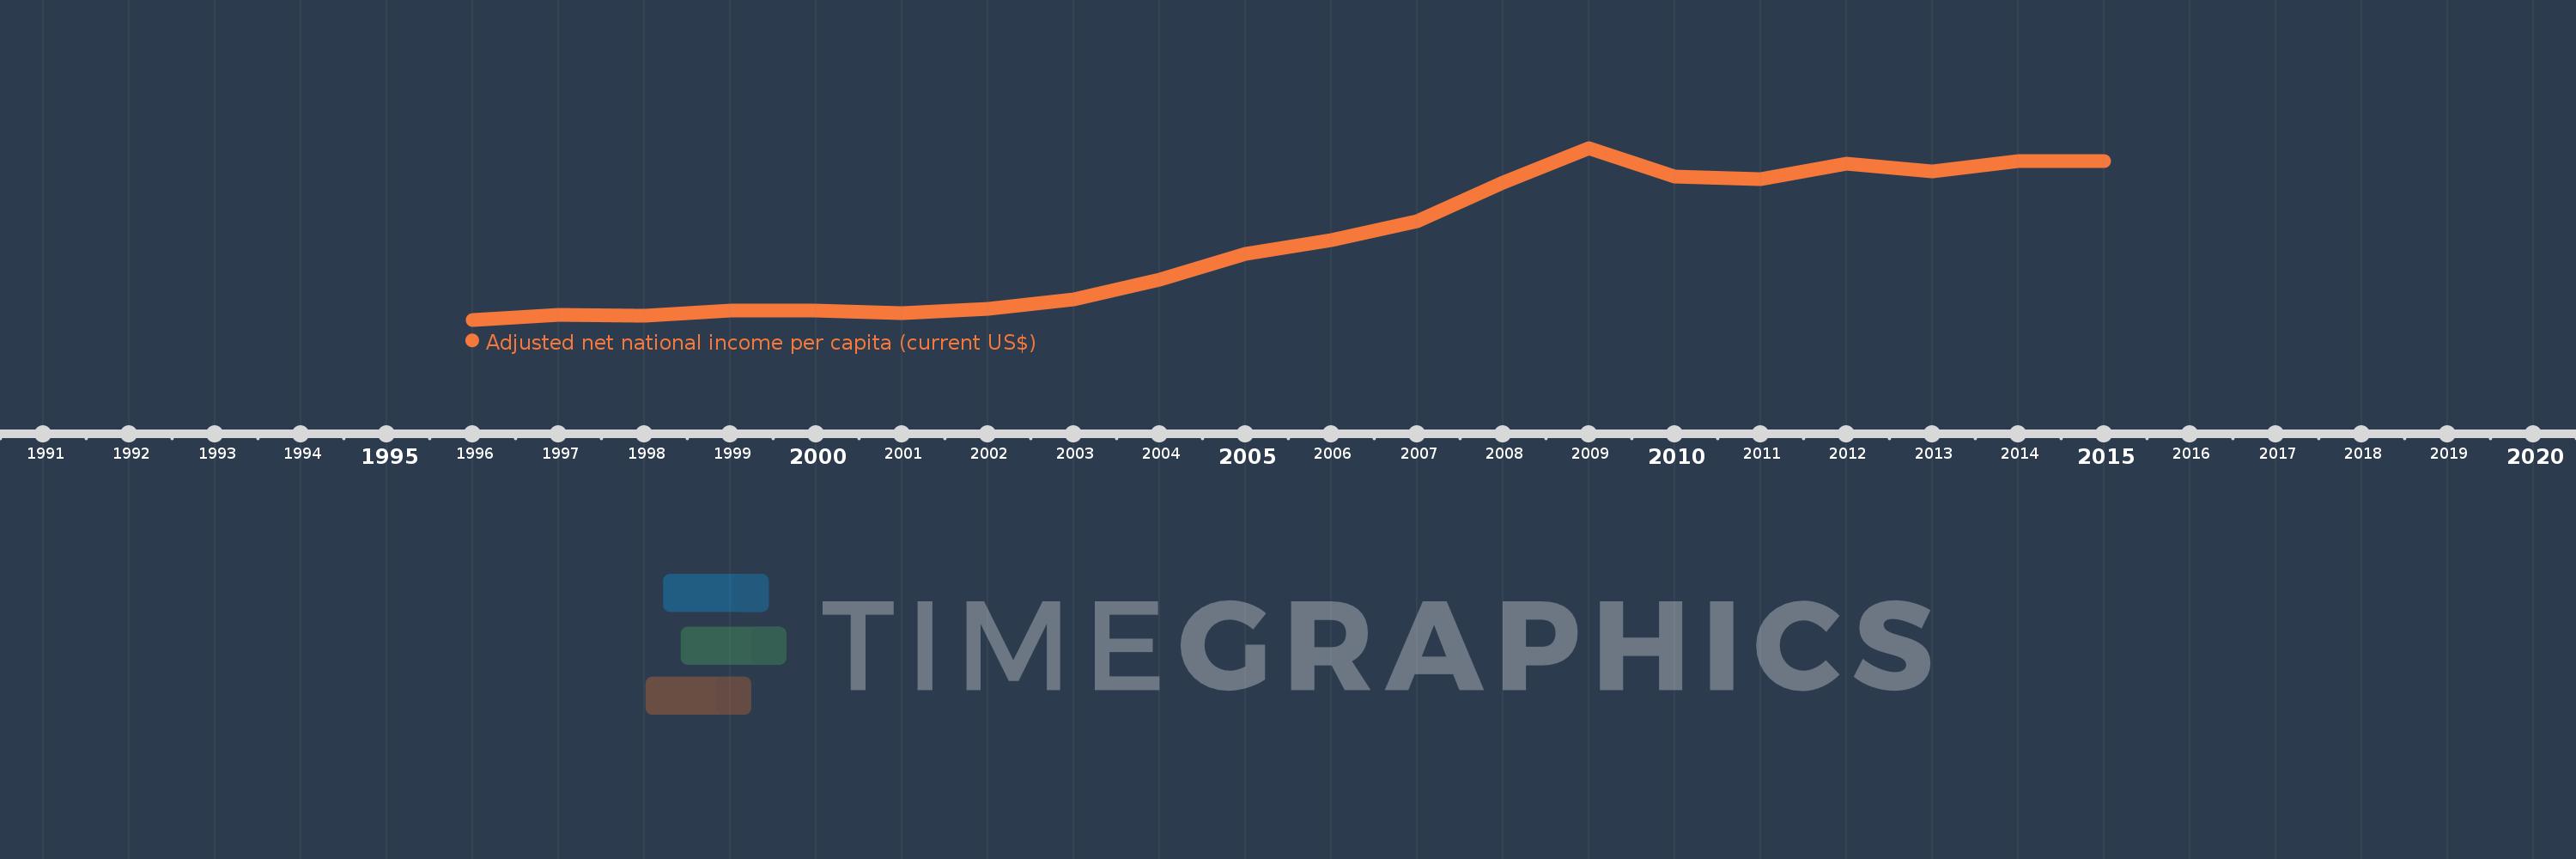
This timeline shows a graph from 1996 to 2015 of Slovak Republic. No data until 1995. Number of actual observations by date: 20.
Source name:
World Development Indicators
Source organization:
World Bank staff estimates based on sources and methods in World Bank's "The Changing Wealth of Nations: Measuring Sustainable Development in the New Millennium" (2011).
Categories, topics:
Economy & Growth
Last updated:
apr 23, 2017
Indicators value changes by year
Meaning:
8.753K
Minimum:
3.711K
jan 1, 1996
Maximum:
14.793K
jan 1, 2009
At the date of observation
Value
Absolute change
Change from the previous value
jan 1, 1996
3.711K
+3.711K
0.0%
jan 1, 1997
4.022K
+311.309
8.39%
jan 1, 1998
3.969K
-53.448
-1.33%
jan 1, 1999
4.286K
+316.768
7.98%
jan 1, 2000
4.301K
+15.595
0.36%
jan 1, 2001
4.127K
-173.948
-4.04%
jan 1, 2002
4.406K
+278.889
6.76%
jan 1, 2003
5.007K
+601.065
13.64%
jan 1, 2004
6.305K
+1.298K
25.92%
jan 1, 2005
7.946K
+1.641K
26.03%
jan 1, 2006
8.844K
+897.708
11.3%
jan 1, 2007
10.094K
+1.25K
14.13%
jan 1, 2008
12.557K
+2.463K
24.4%
jan 1, 2009
14.793K
+2.236K
17.81%
jan 1, 2010
12.954K
-1.839K
-12.43%
jan 1, 2011
12.799K
-155.249
-1.2%
jan 1, 2012
13.758K
+959.605
7.5%
jan 1, 2013
13.289K
-468.699
-3.41%
jan 1, 2014
13.966K
+676.864
5.09%
jan 1, 2015
13.935K
-31.295
-0.22%
Ranking of countries by current statistics by years