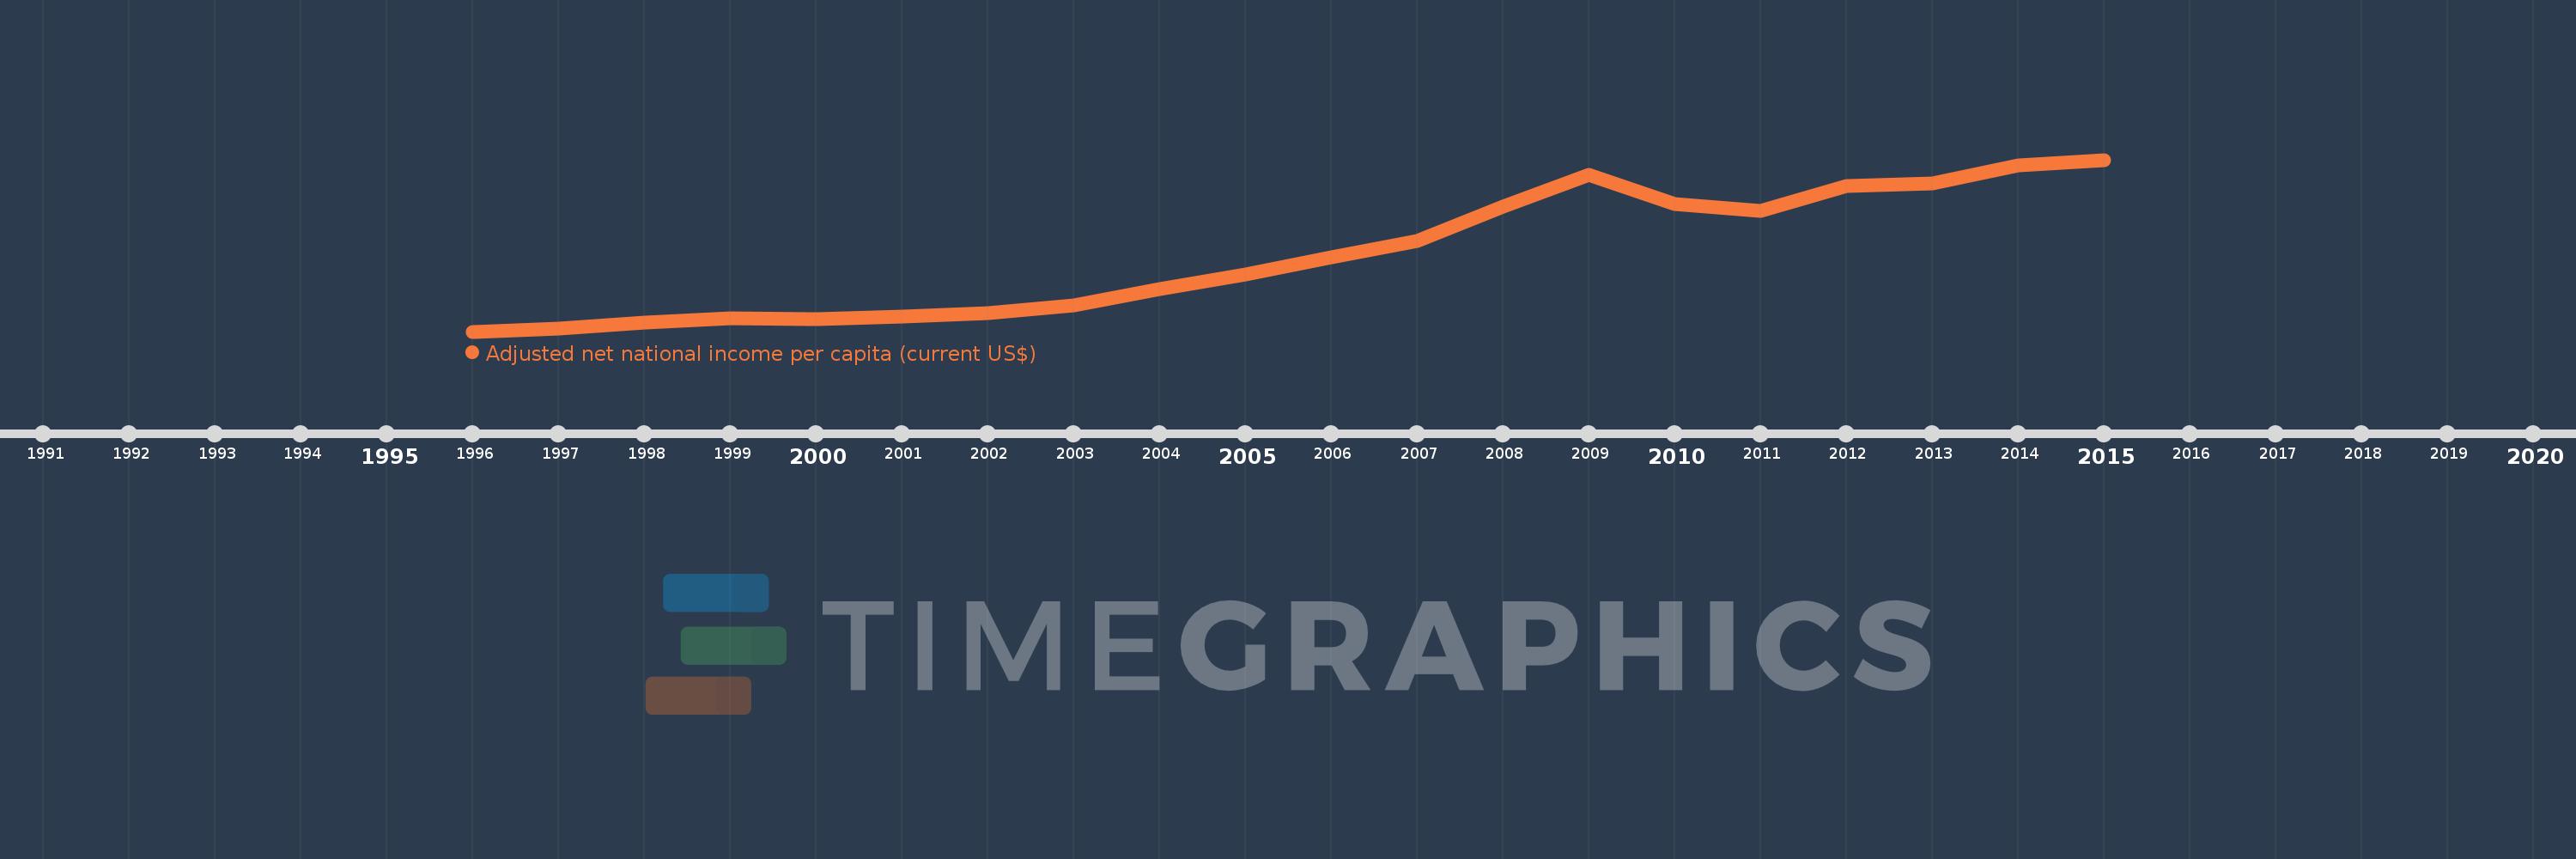
This timeline shows a graph from 1996 to 2015 of Lithuania. No data until 1995. Number of actual observations by date: 20.
Source name:
World Development Indicators
Source organization:
World Bank staff estimates based on sources and methods in World Bank's "The Changing Wealth of Nations: Measuring Sustainable Development in the New Millennium" (2011).
Categories, topics:
Economy & Growth
Last updated:
apr 23, 2017
Indicators value changes by year
Meaning:
6.864K
Minimum:
1.617K
jan 1, 1996
Maximum:
13.45K
jan 1, 2015
At the date of observation
Value
Absolute change
Change from the previous value
jan 1, 1996
1.617K
+1.617K
0.0%
jan 1, 1997
1.804K
+187.618
11.6%
jan 1, 1998
2.257K
+452.219
25.06%
jan 1, 1999
2.559K
+302.01
13.38%
jan 1, 2000
2.497K
-61.415
-2.4%
jan 1, 2001
2.675K
+178.071
7.13%
jan 1, 2002
2.896K
+220.252
8.23%
jan 1, 2003
3.445K
+549.968
18.99%
jan 1, 2004
4.534K
+1.089K
31.6%
jan 1, 2005
5.536K
+1.002K
22.09%
jan 1, 2006
6.716K
+1.18K
21.31%
jan 1, 2007
7.851K
+1.136K
16.91%
jan 1, 2008
10.196K
+2.345K
29.87%
jan 1, 2009
12.429K
+2.233K
21.9%
jan 1, 2010
10.379K
-2.05K
-16.49%
jan 1, 2011
9.914K
-465.03
-4.48%
jan 1, 2012
11.667K
+1.753K
17.68%
jan 1, 2013
11.805K
+138.017
1.18%
jan 1, 2014
13.042K
+1.237K
10.48%
jan 1, 2015
13.45K
+408.52
3.13%
Ranking of countries by current statistics by years