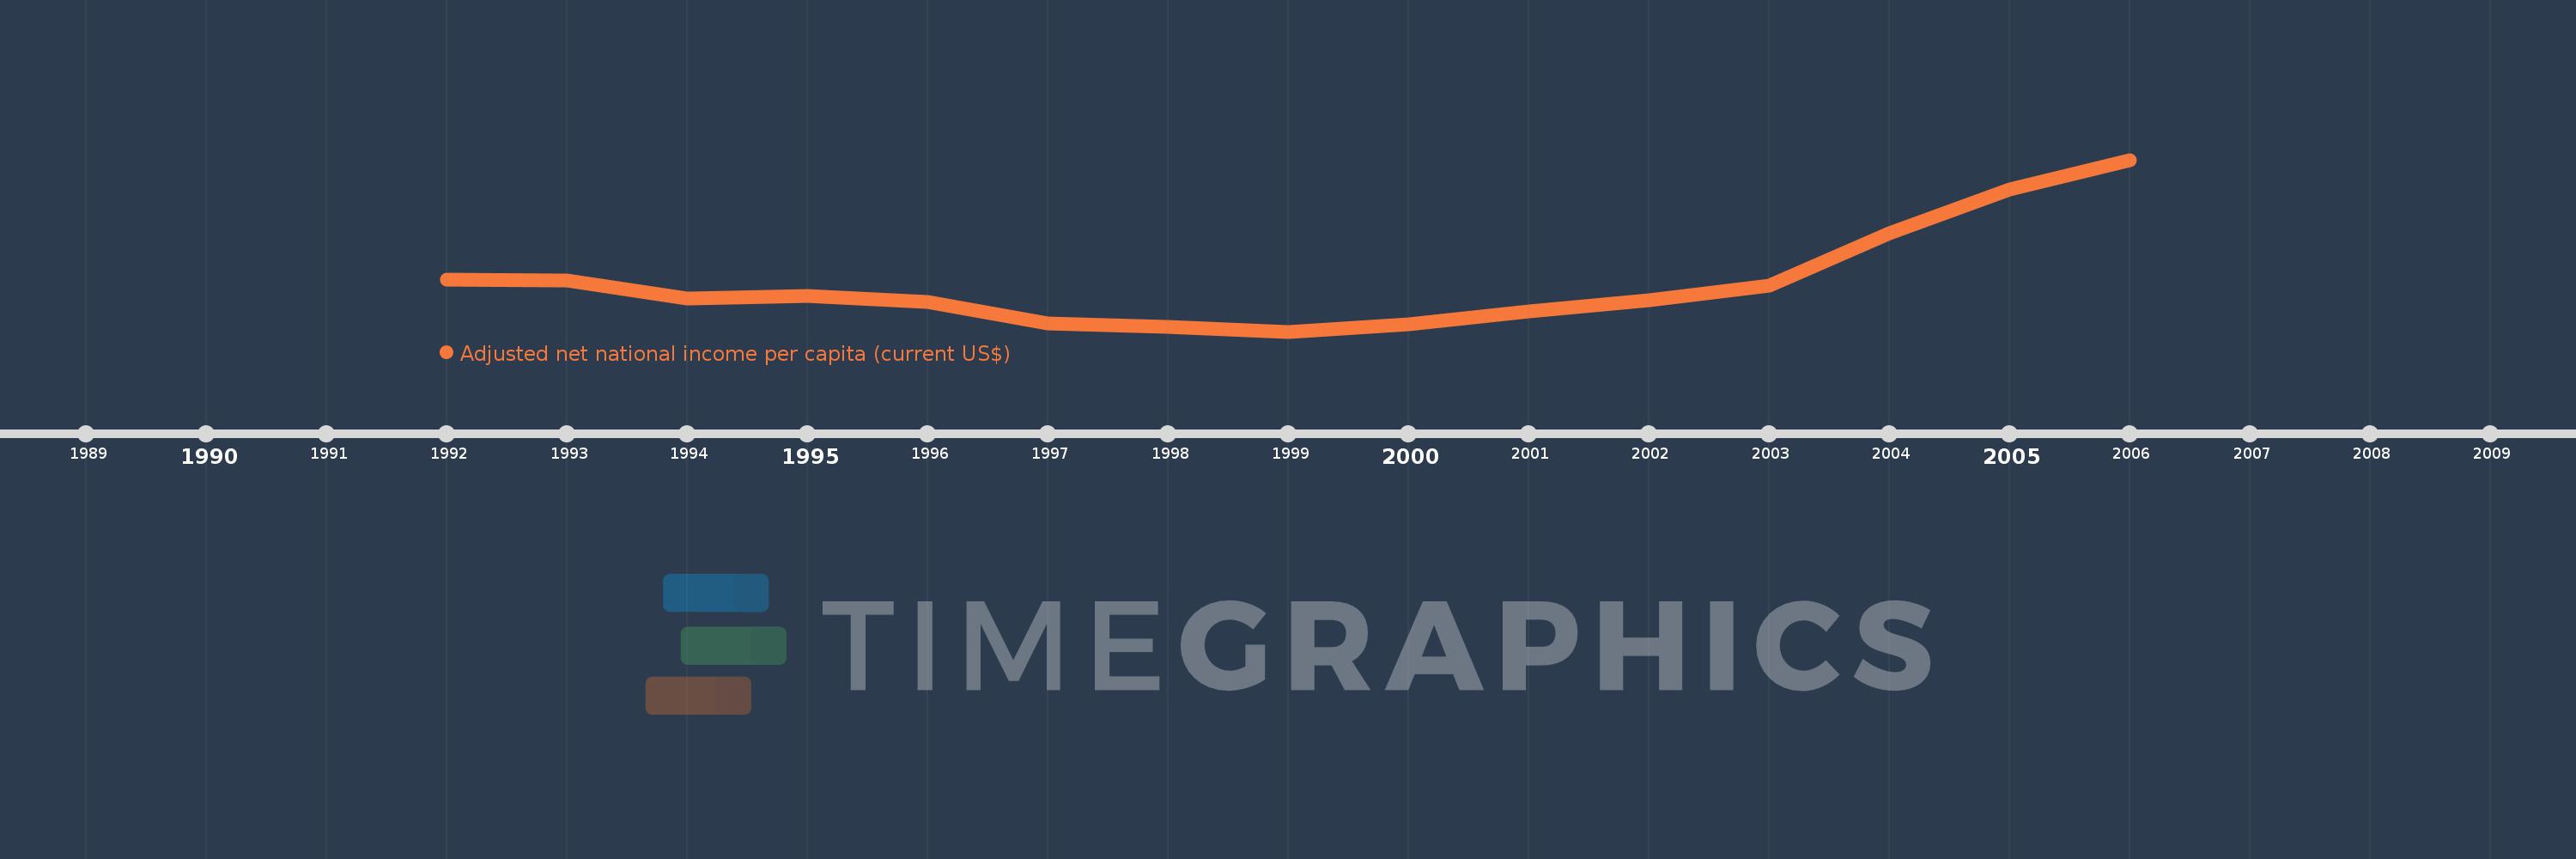
This timeline shows a graph from 1992 to 2006 of Djibouti. No data until 1991. Number of actual observations by date: 15.
Source name:
World Development Indicators
Source organization:
World Bank staff estimates based on sources and methods in World Bank's "The Changing Wealth of Nations: Measuring Sustainable Development in the New Millennium" (2011).
Categories, topics:
Economy & Growth
Last updated:
apr 23, 2017
Indicators value changes by year
Meaning:
722.846
Minimum:
655.181
jan 1, 1999
Maximum:
893.535
jan 1, 2006
At the date of observation
Value
Absolute change
Change from the previous value
jan 1, 1992
726.698
+726.698
0.0%
jan 1, 1993
726.29
-0.408
-0.06%
jan 1, 1994
701.194
-25.096
-3.46%
jan 1, 1995
704.089
+2.894
0.41%
jan 1, 1996
696.837
-7.252
-1.03%
jan 1, 1997
667.028
-29.809
-4.28%
jan 1, 1998
662.084
-4.944
-0.74%
jan 1, 1999
655.181
-6.902
-1.04%
jan 1, 2000
665.769
+10.588
1.62%
jan 1, 2001
683.129
+17.36
2.61%
jan 1, 2002
698.099
+14.97
2.19%
jan 1, 2003
718.513
+20.413
2.92%
jan 1, 2004
792.042
+73.53
10.23%
jan 1, 2005
852.198
+60.155
7.59%
jan 1, 2006
893.535
+41.337
4.85%
Ranking of countries by current statistics by years