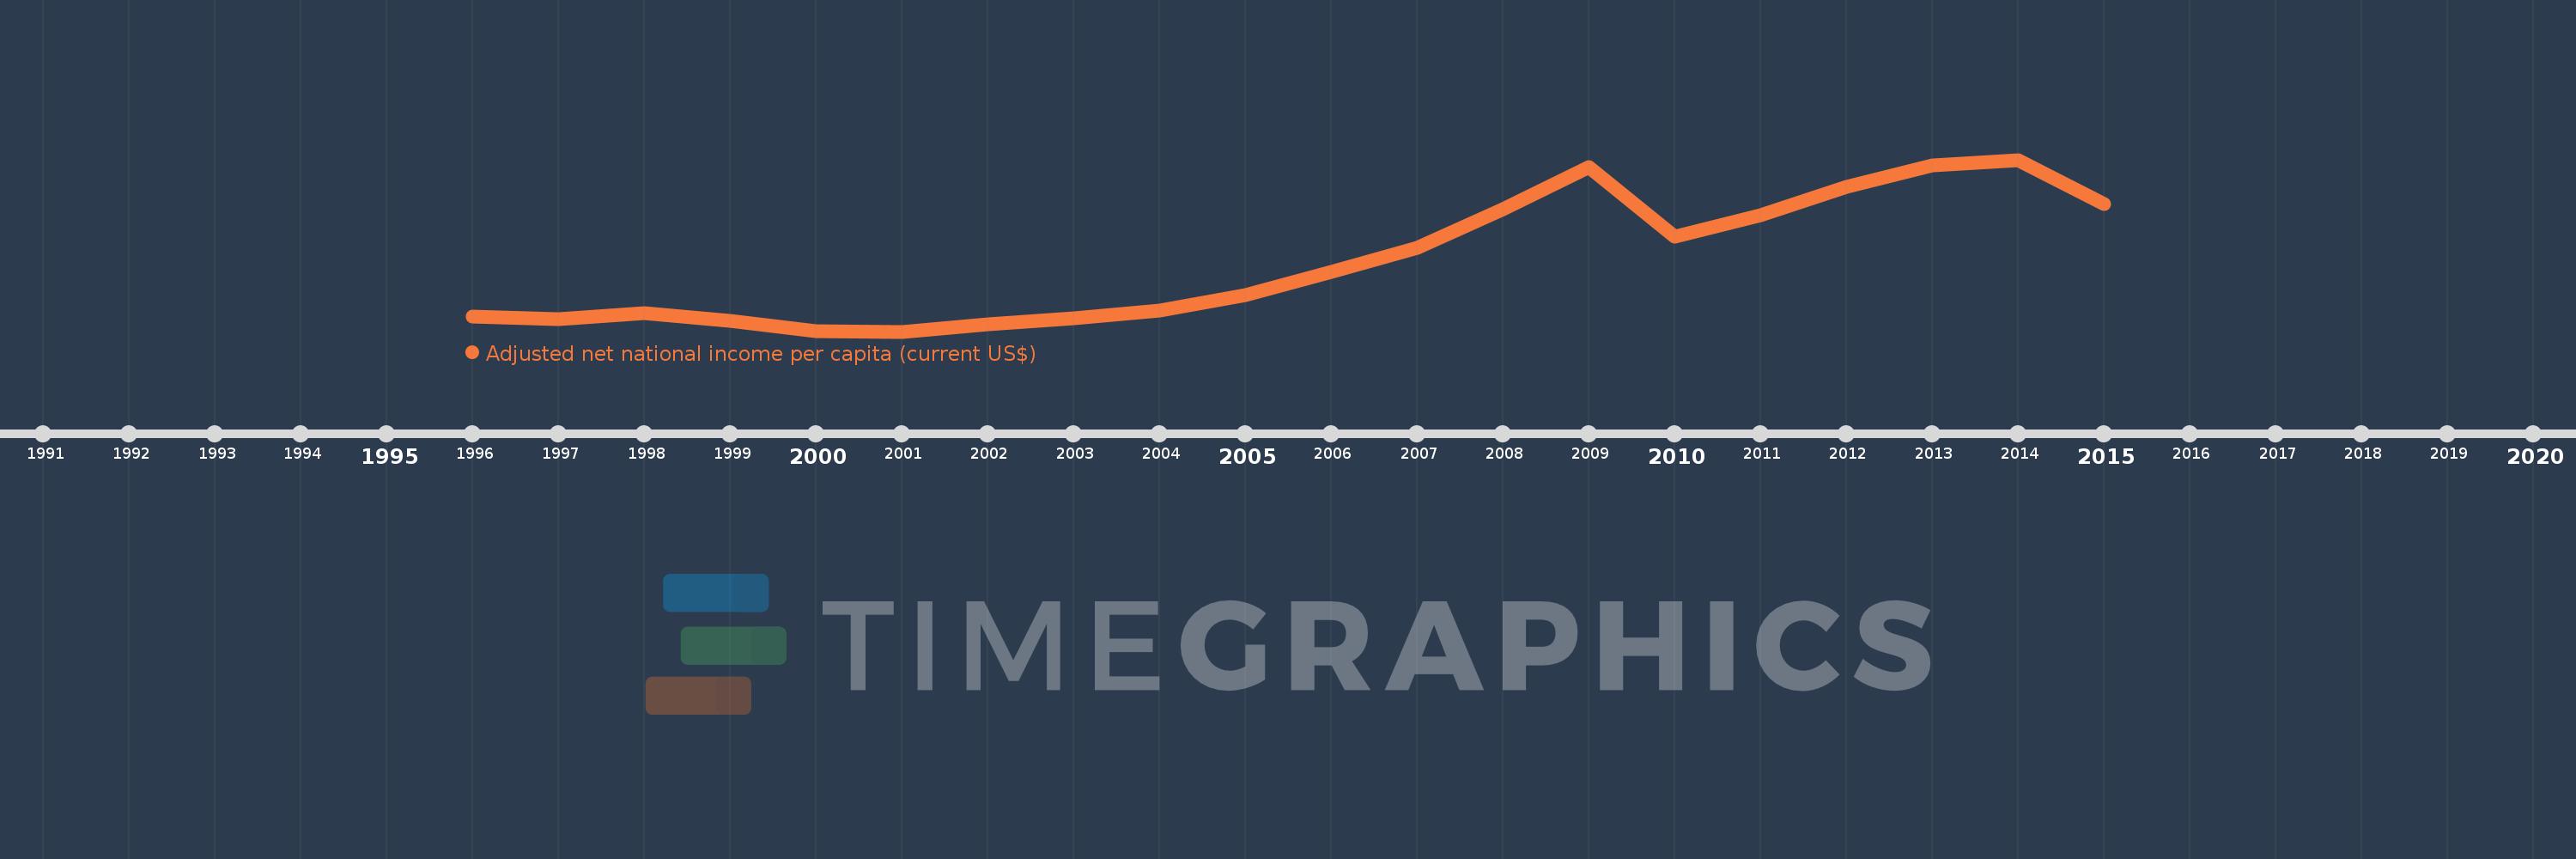
This timeline shows a graph from 1996 to 2015 of Ukraine. No data until 1995. Number of actual observations by date: 20.
Source name:
World Development Indicators
Source organization:
World Bank staff estimates based on sources and methods in World Bank's "The Changing Wealth of Nations: Measuring Sustainable Development in the New Millennium" (2011).
Categories, topics:
Economy & Growth
Last updated:
apr 23, 2017
Indicators value changes by year
Meaning:
1.591K
Minimum:
478.819
jan 1, 2001
Maximum:
3.234K
jan 1, 2014
At the date of observation
Value
Absolute change
Change from the previous value
jan 1, 1996
723.228
+723.228
0.0%
jan 1, 1997
674.731
-48.498
-6.71%
jan 1, 1998
774.393
+99.663
14.77%
jan 1, 1999
648.768
-125.625
-16.22%
jan 1, 2000
487.159
-161.609
-24.91%
jan 1, 2001
478.819
-8.341
-1.71%
jan 1, 2002
599.827
+121.009
25.27%
jan 1, 2003
688.902
+89.075
14.85%
jan 1, 2004
809.835
+120.933
17.55%
jan 1, 2005
1.06K
+250.216
30.9%
jan 1, 2006
1.434K
+373.75
35.26%
jan 1, 2007
1.826K
+391.952
27.34%
jan 1, 2008
2.446K
+620.03
33.96%
jan 1, 2009
3.116K
+670.712
27.42%
jan 1, 2010
1.996K
-1.12K
-35.94%
jan 1, 2011
2.344K
+347.384
17.4%
jan 1, 2012
2.803K
+459.65
19.61%
jan 1, 2013
3.144K
+340.482
12.15%
jan 1, 2014
3.234K
+90.042
2.86%
jan 1, 2015
2.526K
-707.571
-21.88%
Ranking of countries by current statistics by years