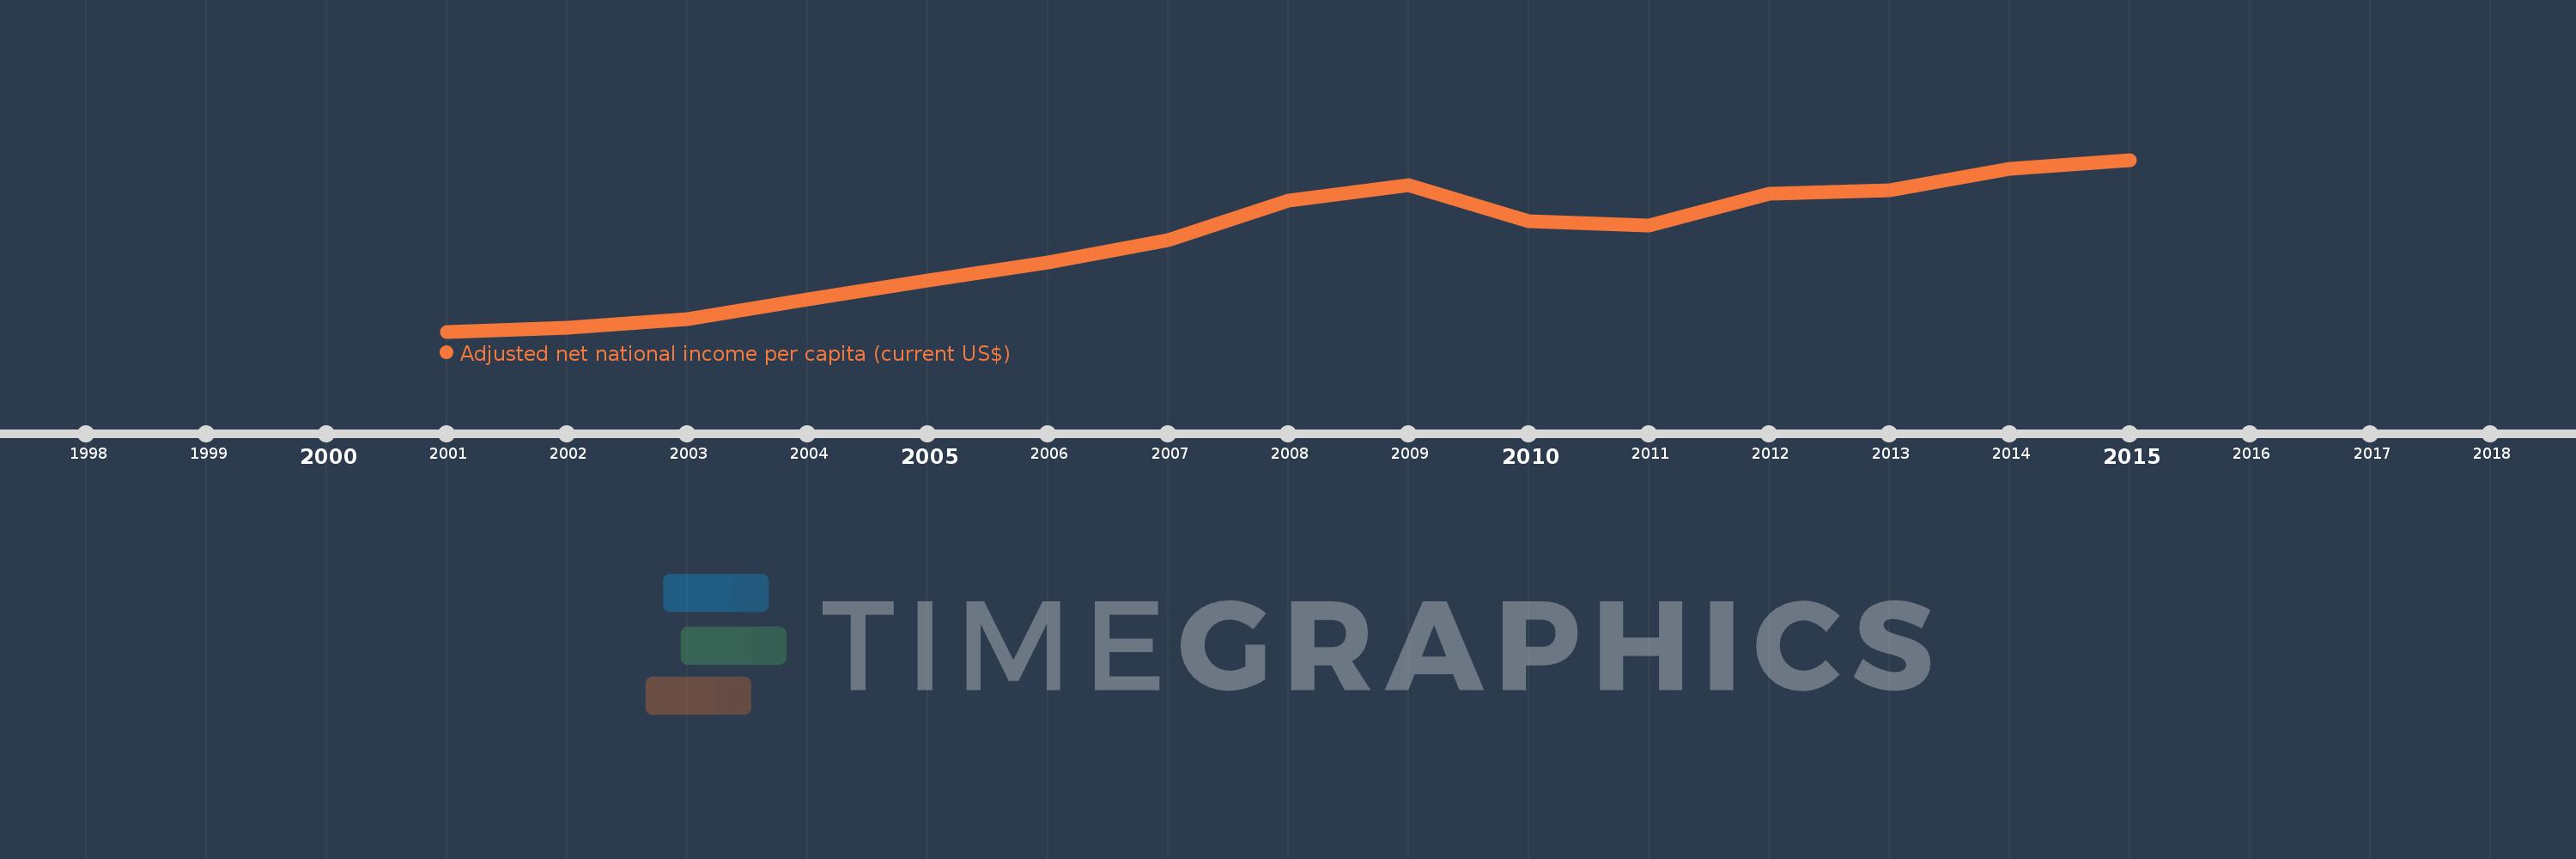
This timeline shows a graph from 2001 to 2015 of Estonia. No data until 2000. Number of actual observations by date: 15.
Source name:
World Development Indicators
Source organization:
World Bank staff estimates based on sources and methods in World Bank's "The Changing Wealth of Nations: Measuring Sustainable Development in the New Millennium" (2011).
Categories, topics:
Economy & Growth
Last updated:
apr 23, 2017
Indicators value changes by year
Meaning:
10.279K
Minimum:
3.345K
jan 1, 2001
Maximum:
16.399K
jan 1, 2015
At the date of observation
Value
Absolute change
Change from the previous value
jan 1, 2001
3.345K
+3.345K
0.0%
jan 1, 2002
3.66K
+314.92
9.41%
jan 1, 2003
4.301K
+641.089
17.51%
jan 1, 2004
5.762K
+1.461K
33.96%
jan 1, 2005
7.211K
+1.449K
25.14%
jan 1, 2006
8.604K
+1.392K
19.31%
jan 1, 2007
10.329K
+1.725K
20.05%
jan 1, 2008
13.303K
+2.975K
28.8%
jan 1, 2009
14.492K
+1.188K
8.93%
jan 1, 2010
11.765K
-2.727K
-18.82%
jan 1, 2011
11.384K
-380.572
-3.23%
jan 1, 2012
13.831K
+2.447K
21.49%
jan 1, 2013
14.108K
+276.982
2.0%
jan 1, 2014
15.687K
+1.579K
11.19%
jan 1, 2015
16.399K
+712.162
4.54%
Ranking of countries by current statistics by years