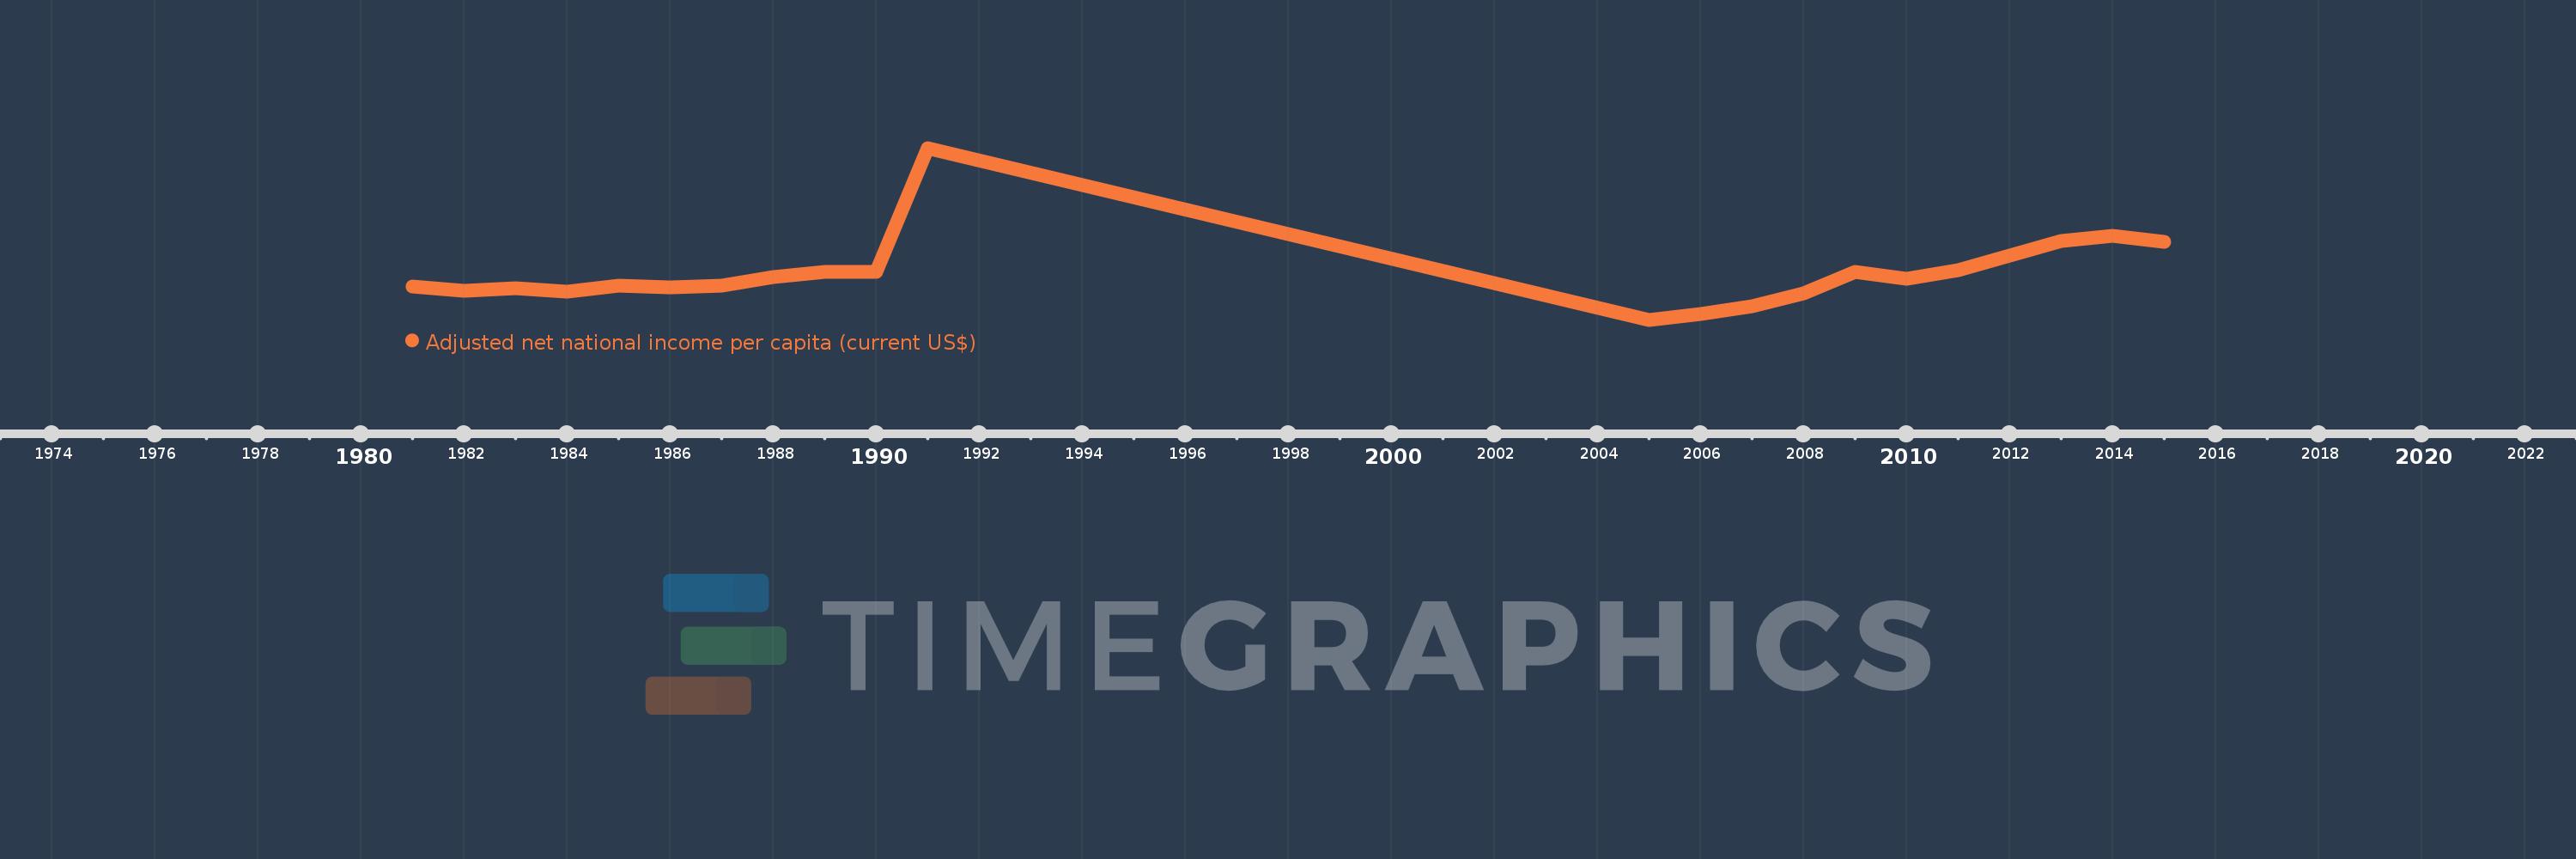
This timeline shows a graph from 1981 to 2015 of Iraq. No data until 1980. Number of actual observations by date: 22.
Source name:
World Development Indicators
Source organization:
World Bank staff estimates based on sources and methods in World Bank's "The Changing Wealth of Nations: Measuring Sustainable Development in the New Millennium" (2011).
Categories, topics:
Economy & Growth
Last updated:
apr 23, 2017
Indicators value changes by year
Meaning:
2.929K
Minimum:
728.697
jan 1, 2005
Maximum:
8.881K
jan 1, 1991
At the date of observation
Value
Absolute change
Change from the previous value
jan 1, 1981
2.311K
+2.311K
0.0%
jan 1, 1982
2.101K
-209.618
-9.07%
jan 1, 1983
2.207K
+106.206
5.05%
jan 1, 1984
2.044K
-163.111
-7.39%
jan 1, 1985
2.338K
+294.073
14.39%
jan 1, 1986
2.28K
-58.257
-2.49%
jan 1, 1987
2.342K
+61.721
2.71%
jan 1, 1988
2.734K
+392.668
16.77%
jan 1, 1989
3.009K
+274.166
10.03%
jan 1, 1990
2.994K
-14.68
-0.49%
jan 1, 1991
8.881K
+5.887K
196.62%
jan 1, 2005
728.697
-8.152K
-91.79%
jan 1, 2006
1.009K
+280.229
38.46%
jan 1, 2007
1.36K
+350.743
34.76%
jan 1, 2008
1.975K
+615.031
45.23%
jan 1, 2009
2.993K
+1.018K
51.55%
jan 1, 2010
2.682K
-310.425
-10.37%
jan 1, 2011
3.097K
+415.091
15.48%
jan 1, 2012
3.775K
+677.439
21.87%
jan 1, 2013
4.45K
+675.27
17.89%
jan 1, 2014
4.73K
+280.456
6.3%
jan 1, 2015
4.406K
-324.045
-6.85%
Ranking of countries by current statistics by years