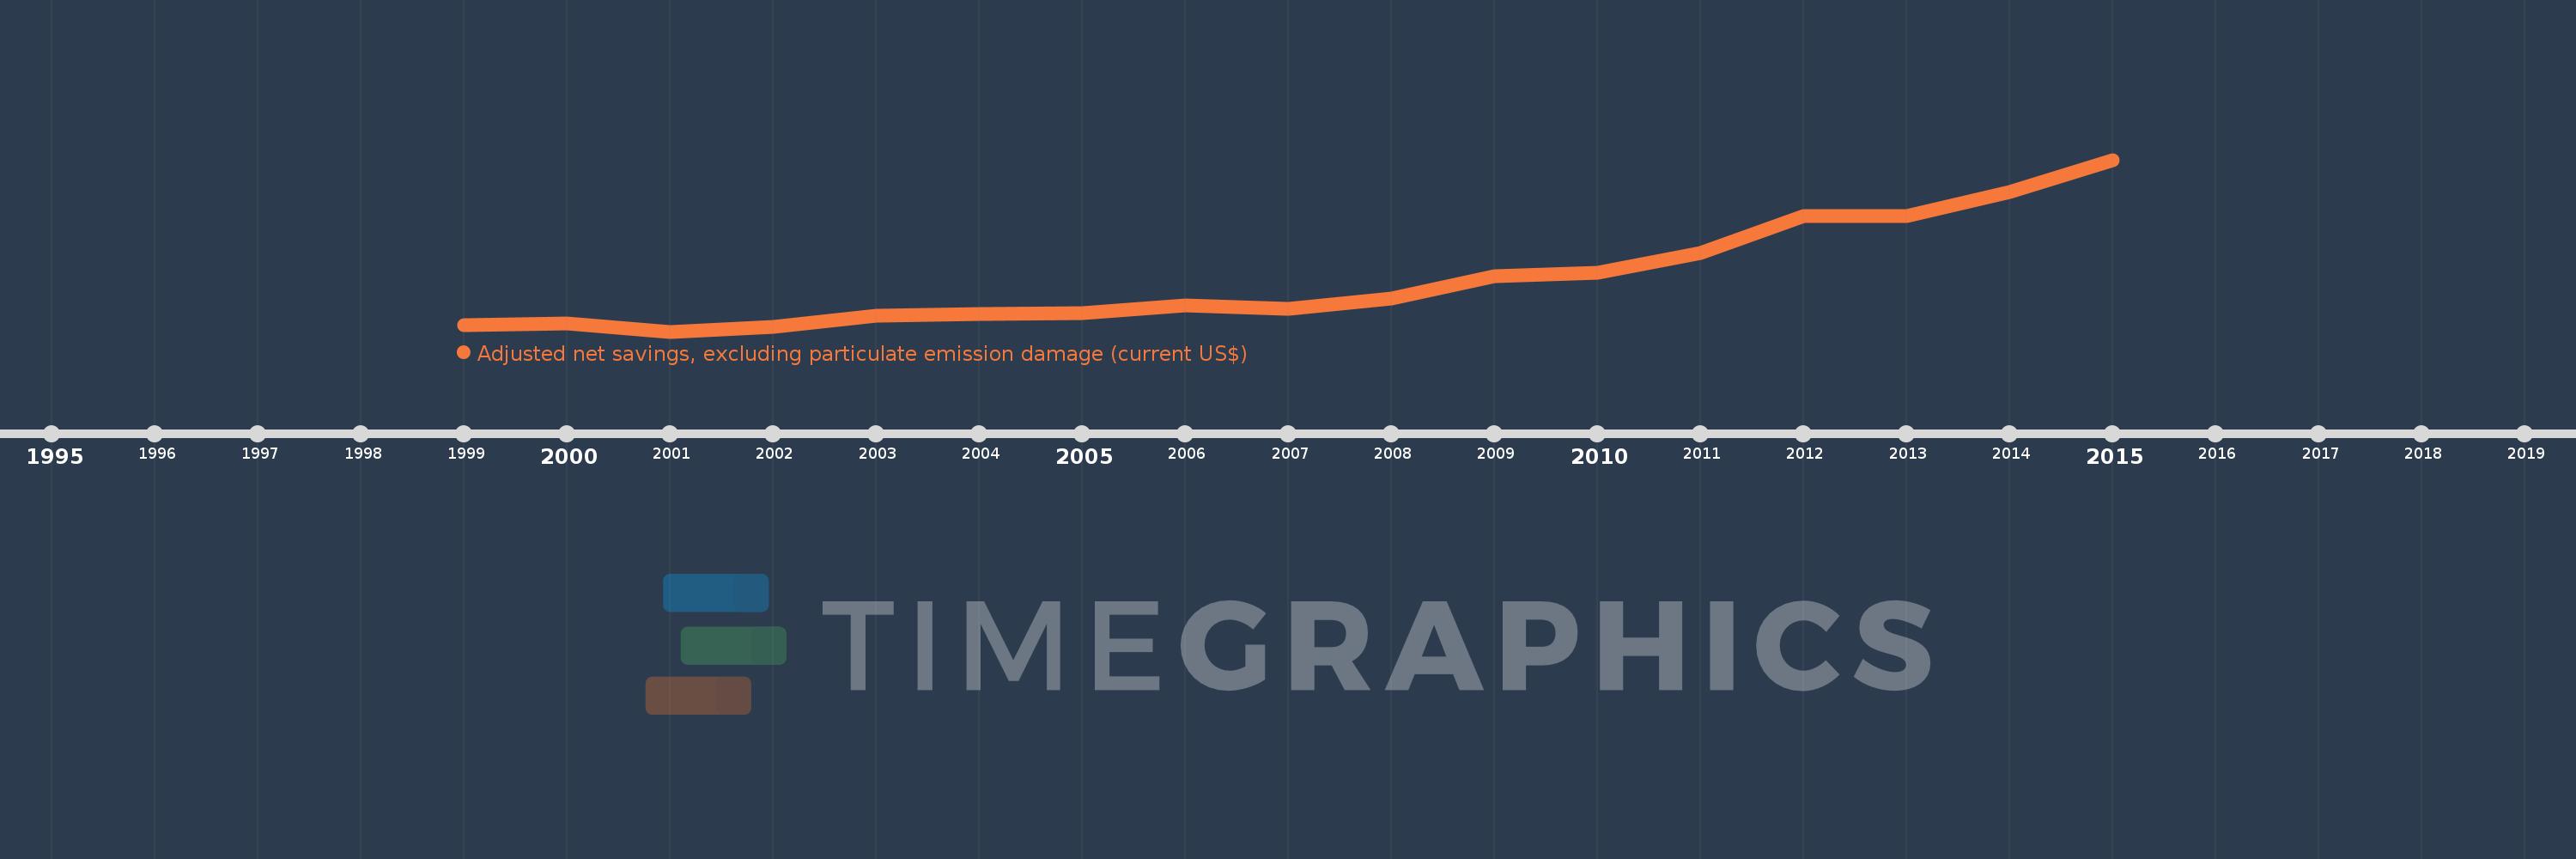
This timeline shows a graph from 1999 to 2015 of Azerbaijan. No data until 1998. Number of actual observations by date: 17.
Source name:
World Development Indicators
Source organization:
World Bank staff estimates based on sources and methods in World Bank's "The Changing Wealth of Nations: Measuring Sustainable Development in the New Millennium" (2011).
Categories, topics:
Economy & Growth, Environment
Last updated:
apr 23, 2017
Indicators value changes by year
Meaning:
2.662 bln
Minimum:
-1.905 bln
jan 1, 2001
Maximum:
13.116 bln
jan 1, 2015
At the date of observation
Value
Absolute change
Change from the previous value
jan 1, 1999
-1.34 bln
-1.34 bln
0.0%
jan 1, 2000
-1.219 bln
+120.533 mln
-9.0%
jan 1, 2001
-1.905 bln
-685.934 mln
56.26%
jan 1, 2002
-1.493 bln
+411.59 mln
-21.61%
jan 1, 2003
-522.629 mln
+970.828 mln
-65.01%
jan 1, 2004
-344.138 mln
+178.491 mln
-34.15%
jan 1, 2005
-283.268 mln
+60.871 mln
-17.69%
jan 1, 2006
351.531 mln
+634.799 mln
-224.1%
jan 1, 2007
63.925 mln
-287.606 mln
-81.82%
jan 1, 2008
967.697 mln
+903.772 mln
1.41K%
jan 1, 2009
2.912 bln
+1.945 bln
200.96%
jan 1, 2010
3.26 bln
+347.449 mln
11.93%
jan 1, 2011
5.002 bln
+1.742 bln
53.44%
jan 1, 2012
8.184 bln
+3.182 bln
63.61%
jan 1, 2013
8.232 bln
+48.754 mln
0.6%
jan 1, 2014
10.28 bln
+2.048 bln
24.87%
jan 1, 2015
13.116 bln
+2.836 bln
27.59%
Ranking of countries by current statistics by years