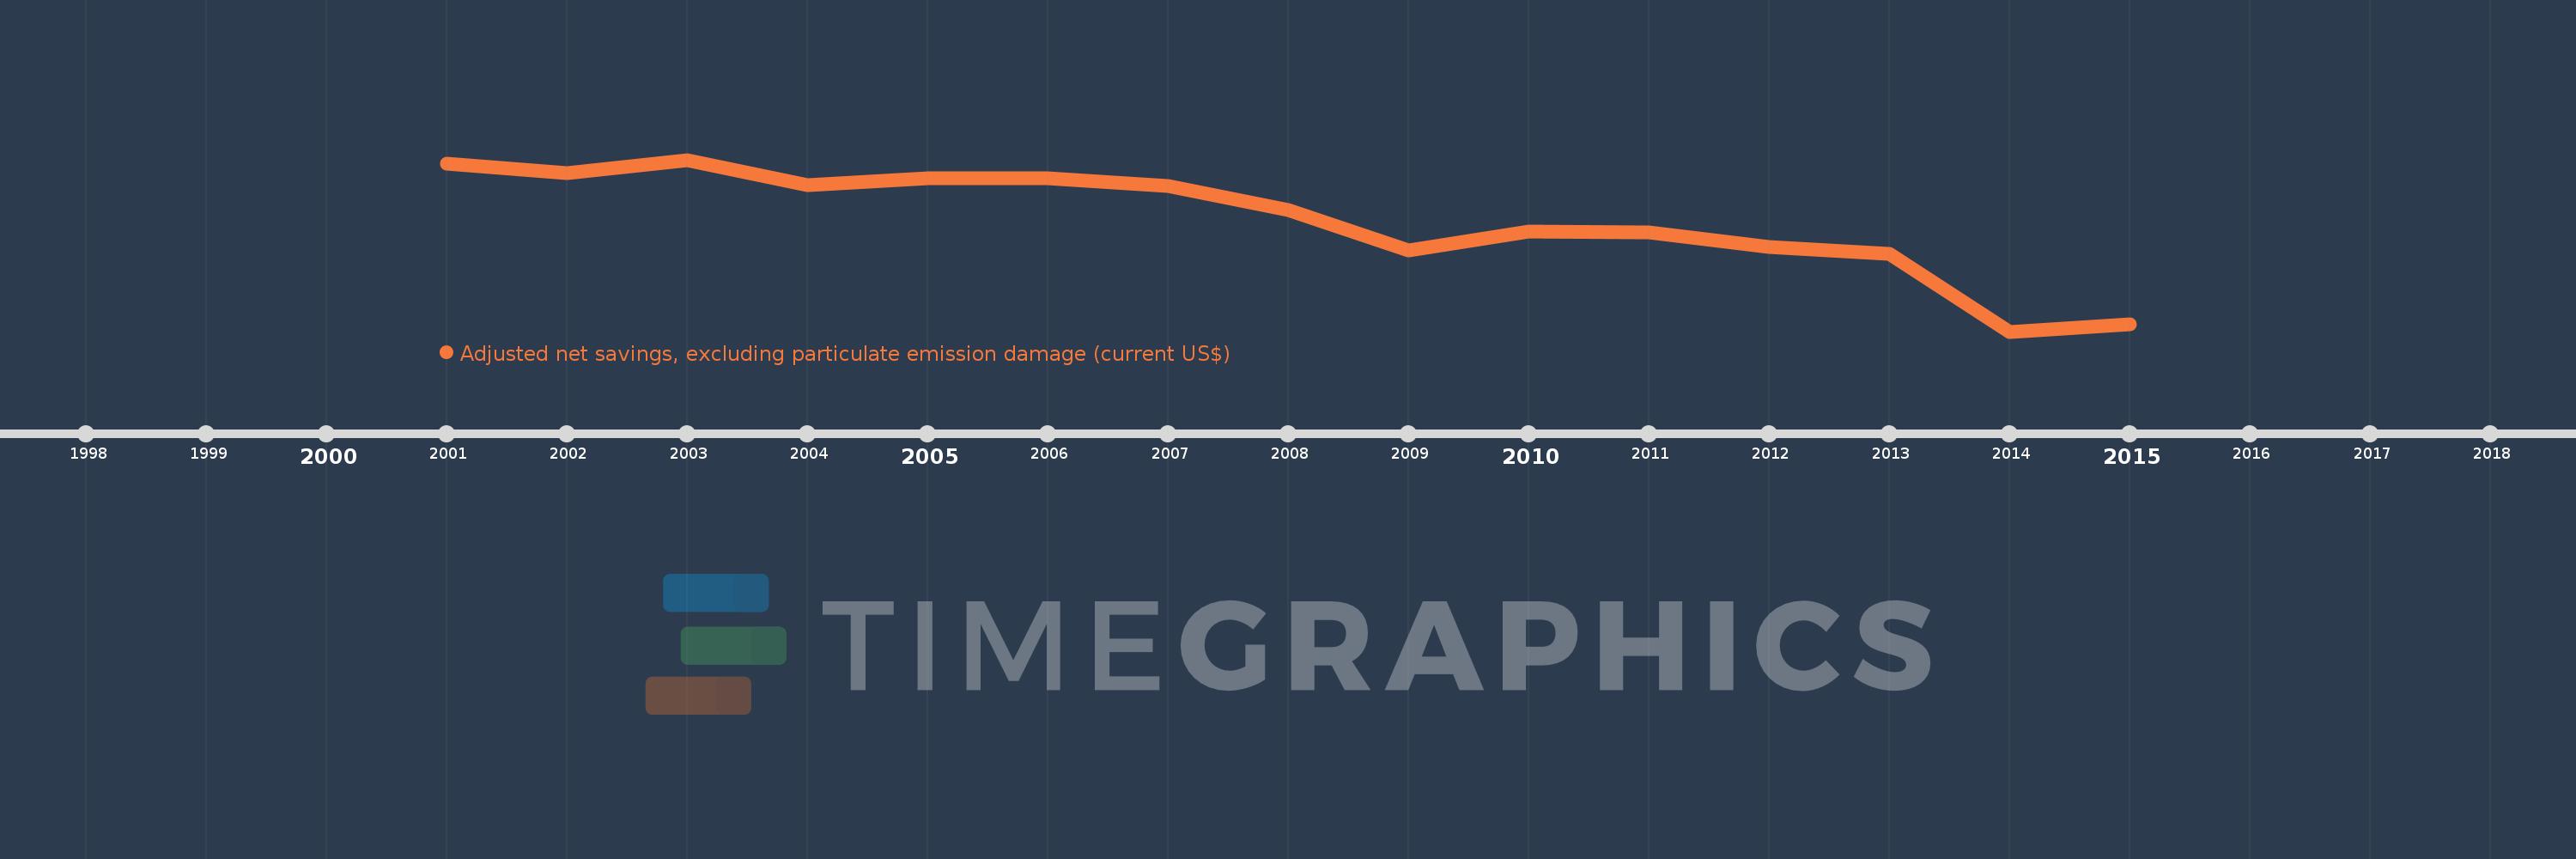
This timeline shows a graph from 2001 to 2015 of Congo, Dem. Rep.. No data until 2000. Number of actual observations by date: 15.
Source name:
World Development Indicators
Source organization:
World Bank staff estimates based on sources and methods in World Bank's "The Changing Wealth of Nations: Measuring Sustainable Development in the New Millennium" (2011).
Categories, topics:
Economy & Growth, Environment
Last updated:
apr 23, 2017
Indicators value changes by year
Meaning:
-2.85 bln
Minimum:
-7.577 bln
jan 1, 2014
Maximum:
-280.47 mln
jan 1, 2003
At the date of observation
Value
Absolute change
Change from the previous value
jan 1, 2001
-434.394 mln
-434.394 mln
0.0%
jan 1, 2002
-842.333 mln
-407.939 mln
93.91%
jan 1, 2003
-280.47 mln
+561.864 mln
-66.7%
jan 1, 2004
-1.372 bln
-1.092 bln
389.18%
jan 1, 2005
-1.061 bln
+310.942 mln
-22.66%
jan 1, 2006
-1.074 bln
-13.273 mln
1.25%
jan 1, 2007
-1.377 bln
-302.748 mln
28.18%
jan 1, 2008
-2.408 bln
-1.031 bln
74.88%
jan 1, 2009
-4.132 bln
-1.723 bln
71.57%
jan 1, 2010
-3.318 bln
+813.298 mln
-19.68%
jan 1, 2011
-3.374 bln
-55.799 mln
1.68%
jan 1, 2012
-3.986 bln
-612.226 mln
18.14%
jan 1, 2013
-4.26 bln
-273.896 mln
6.87%
jan 1, 2014
-7.577 bln
-3.317 bln
77.85%
jan 1, 2015
-7.258 bln
+319.18 mln
-4.21%
Ranking of countries by current statistics by years