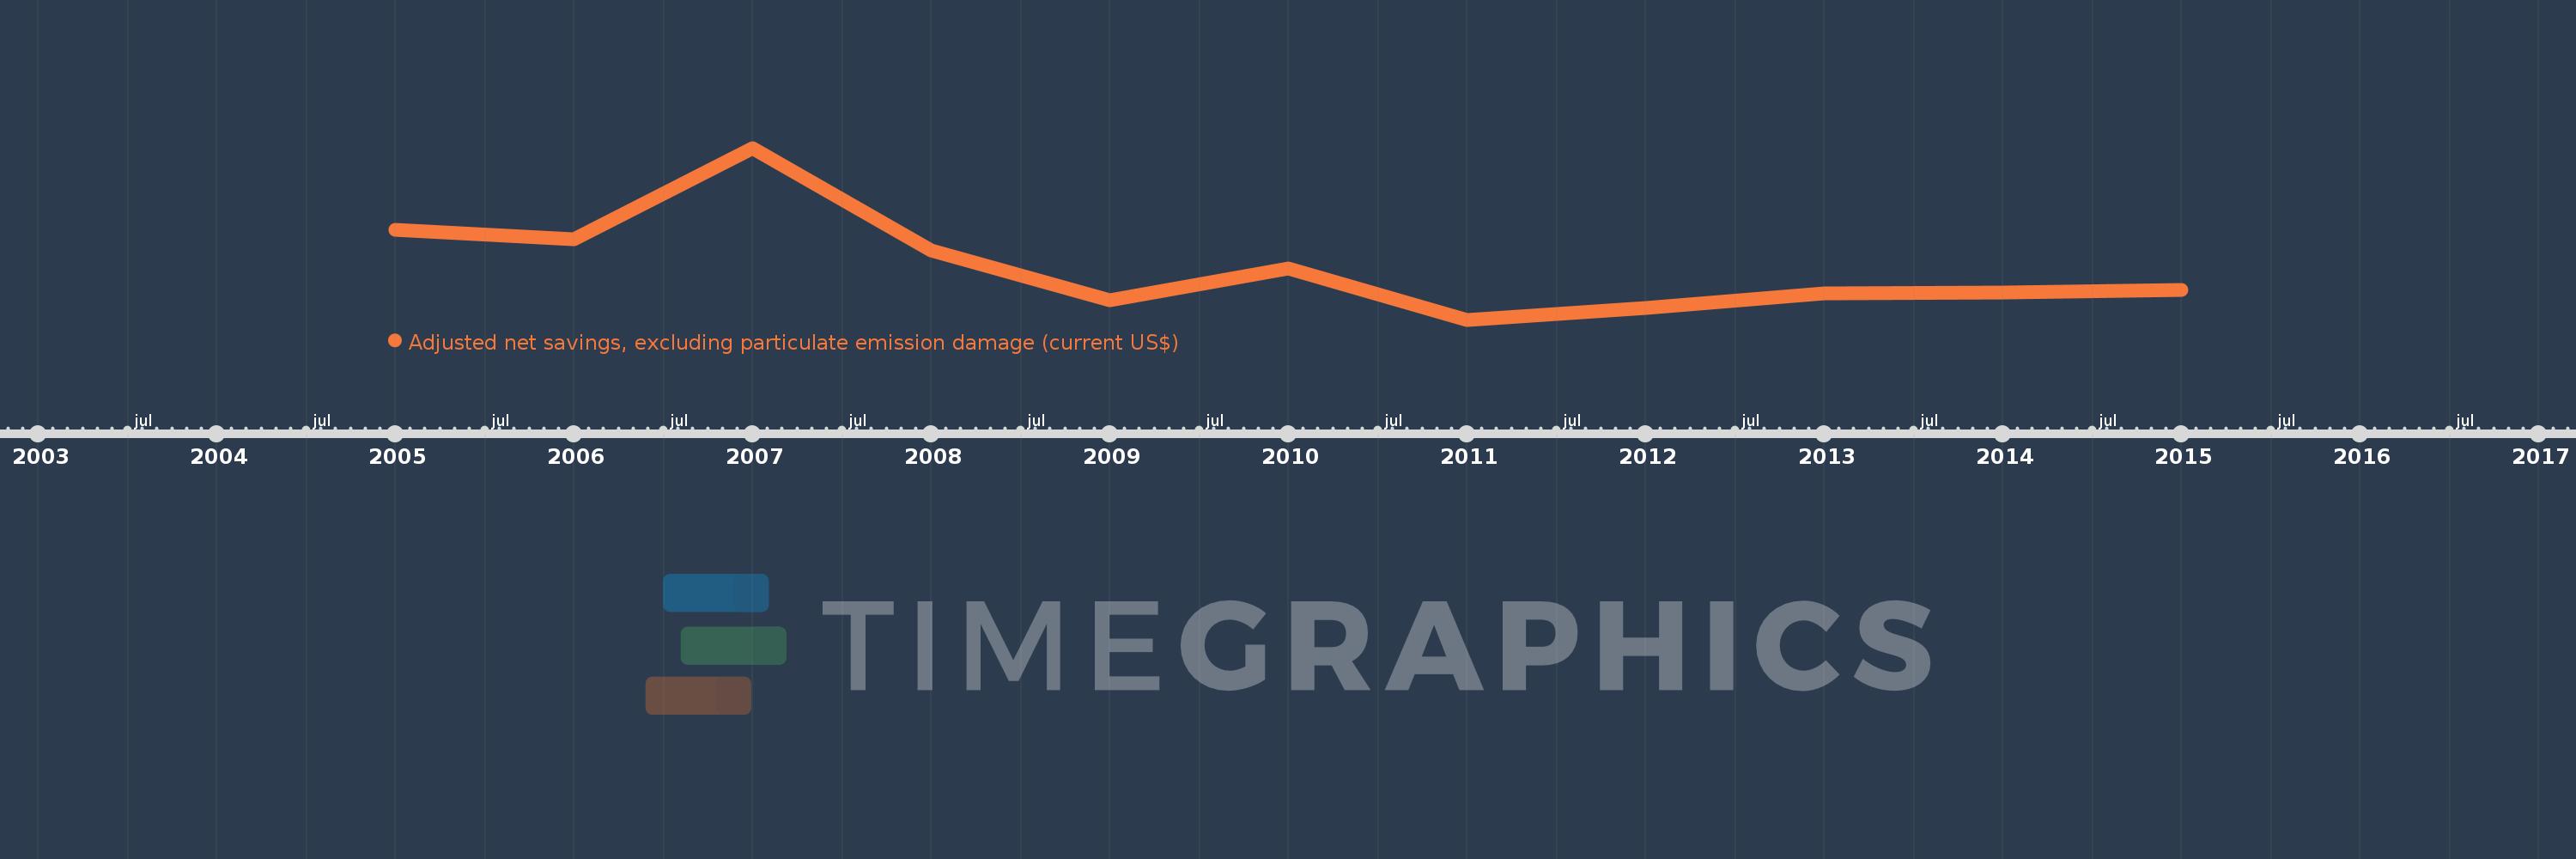
This timeline shows a graph from 2005 to 2015 of Liberia. No data until 2004. Number of actual observations by date: 11.
Source name:
World Development Indicators
Source organization:
World Bank staff estimates based on sources and methods in World Bank's "The Changing Wealth of Nations: Measuring Sustainable Development in the New Millennium" (2011).
Categories, topics:
Economy & Growth, Environment
Last updated:
apr 23, 2017
Indicators value changes by year
Meaning:
-311.087 mln
Minimum:
-631.855 mln
jan 1, 2011
Maximum:
416.8 mln
jan 1, 2007
At the date of observation
Value
Absolute change
Change from the previous value
jan 1, 2005
-83.319 mln
-83.319 mln
0.0%
jan 1, 2006
-141.33 mln
-58.01 mln
69.62%
jan 1, 2007
416.8 mln
+558.13 mln
-394.91%
jan 1, 2008
-206.321 mln
-623.121 mln
-149.5%
jan 1, 2009
-513.139 mln
-306.818 mln
148.71%
jan 1, 2010
-316.267 mln
+196.872 mln
-38.37%
jan 1, 2011
-631.855 mln
-315.588 mln
99.79%
jan 1, 2012
-558.9 mln
+72.955 mln
-11.55%
jan 1, 2013
-473.012 mln
+85.888 mln
-15.37%
jan 1, 2014
-467.032 mln
+5.98 mln
-1.26%
jan 1, 2015
-447.586 mln
+19.445 mln
-4.16%
Ranking of countries by current statistics by years