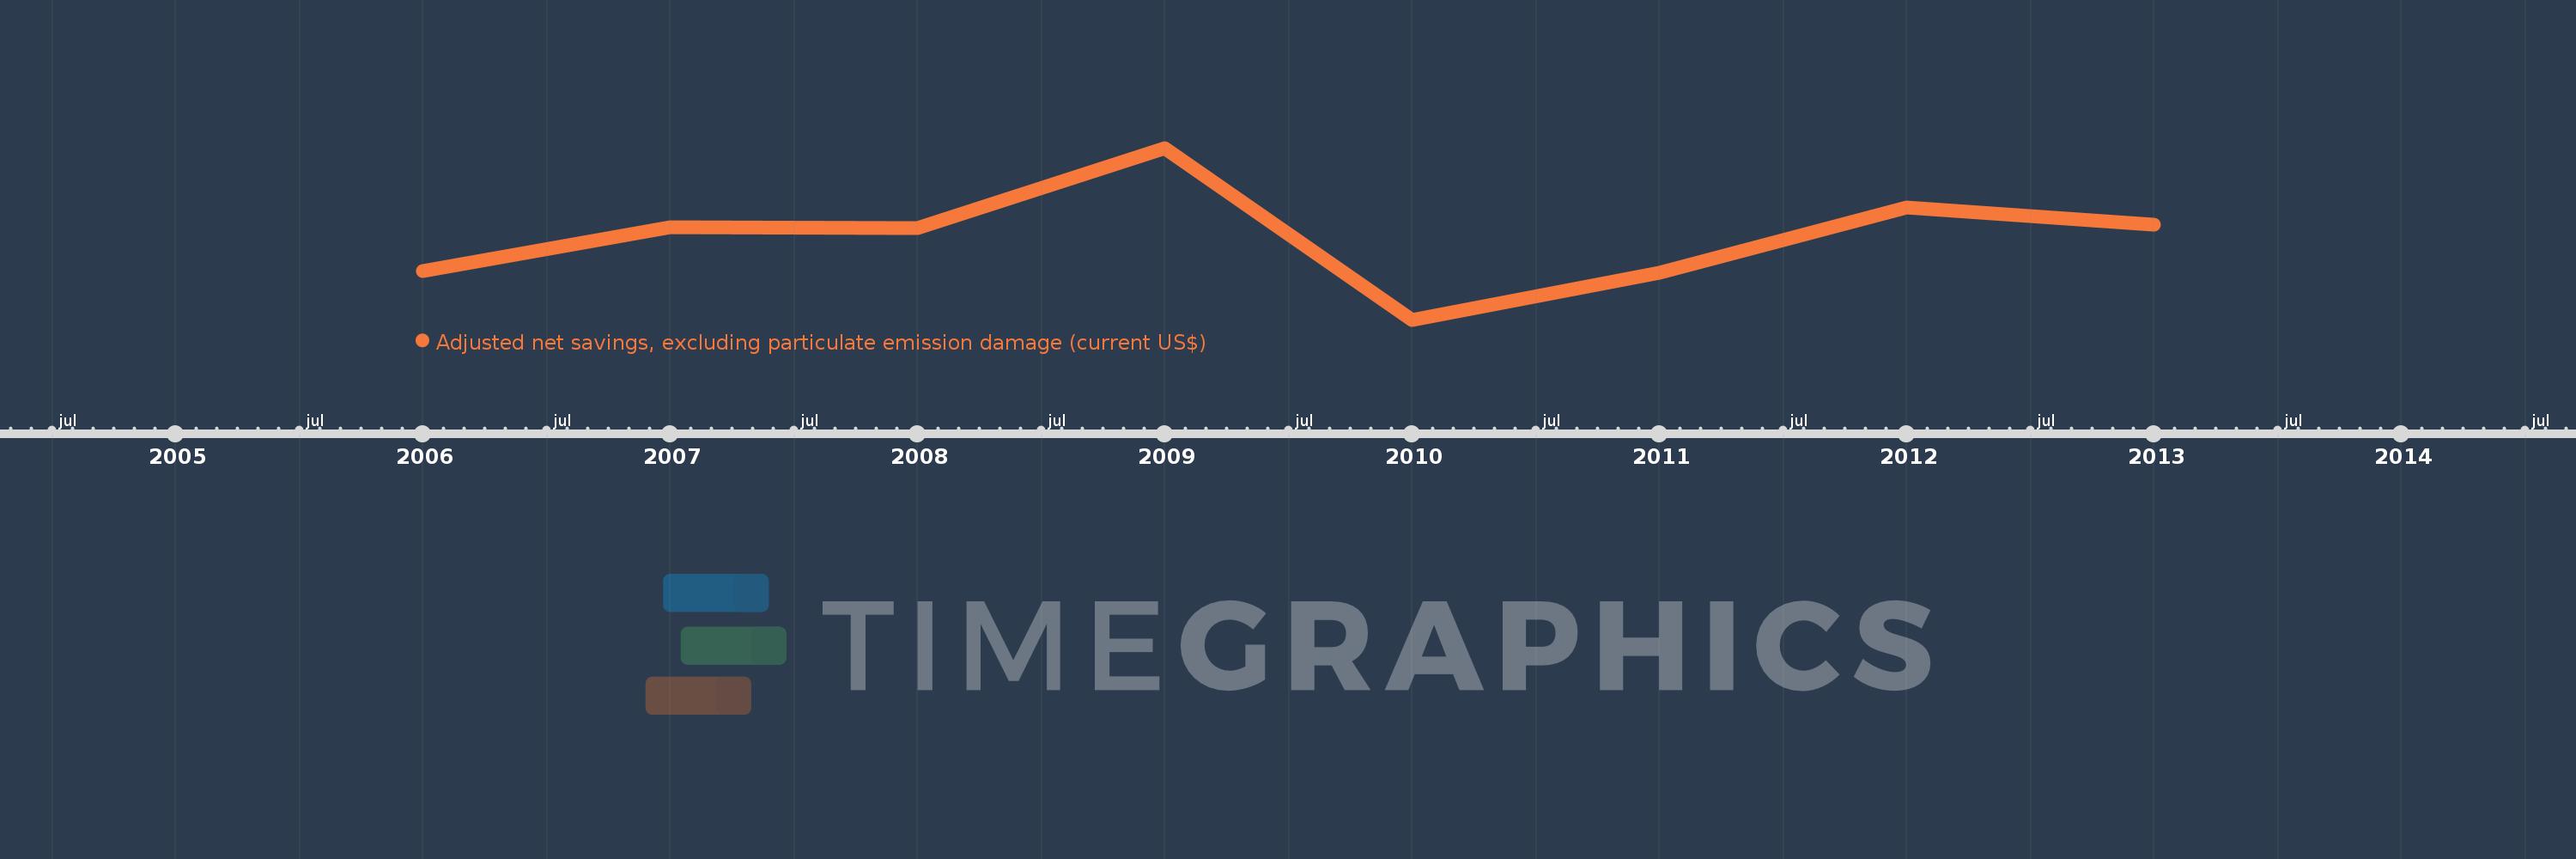
This timeline shows a graph from 2006 to 2013 of Iraq. No data until 2005. Number of actual observations by date: 8.
Source name:
World Development Indicators
Source organization:
World Bank staff estimates based on sources and methods in World Bank's "The Changing Wealth of Nations: Measuring Sustainable Development in the New Millennium" (2011).
Categories, topics:
Economy & Growth, Environment
Last updated:
apr 23, 2017
Indicators value changes by year
Meaning:
-6.496 bln
Minimum:
-16.211 bln
jan 1, 2010
Maximum:
4.045 bln
jan 1, 2009
At the date of observation
Value
Absolute change
Change from the previous value
jan 1, 2006
-10.501 bln
-10.501 bln
0.0%
jan 1, 2007
-5.304 bln
+5.197 bln
-49.49%
jan 1, 2008
-5.452 bln
-147.949 mln
2.79%
jan 1, 2009
4.045 bln
+9.497 bln
-174.2%
jan 1, 2010
-16.211 bln
-20.256 bln
-500.75%
jan 1, 2011
-10.647 bln
+5.564 bln
-34.32%
jan 1, 2012
-2.937 bln
+7.709 bln
-72.41%
jan 1, 2013
-4.96 bln
-2.023 bln
68.87%
Ranking of countries by current statistics by years