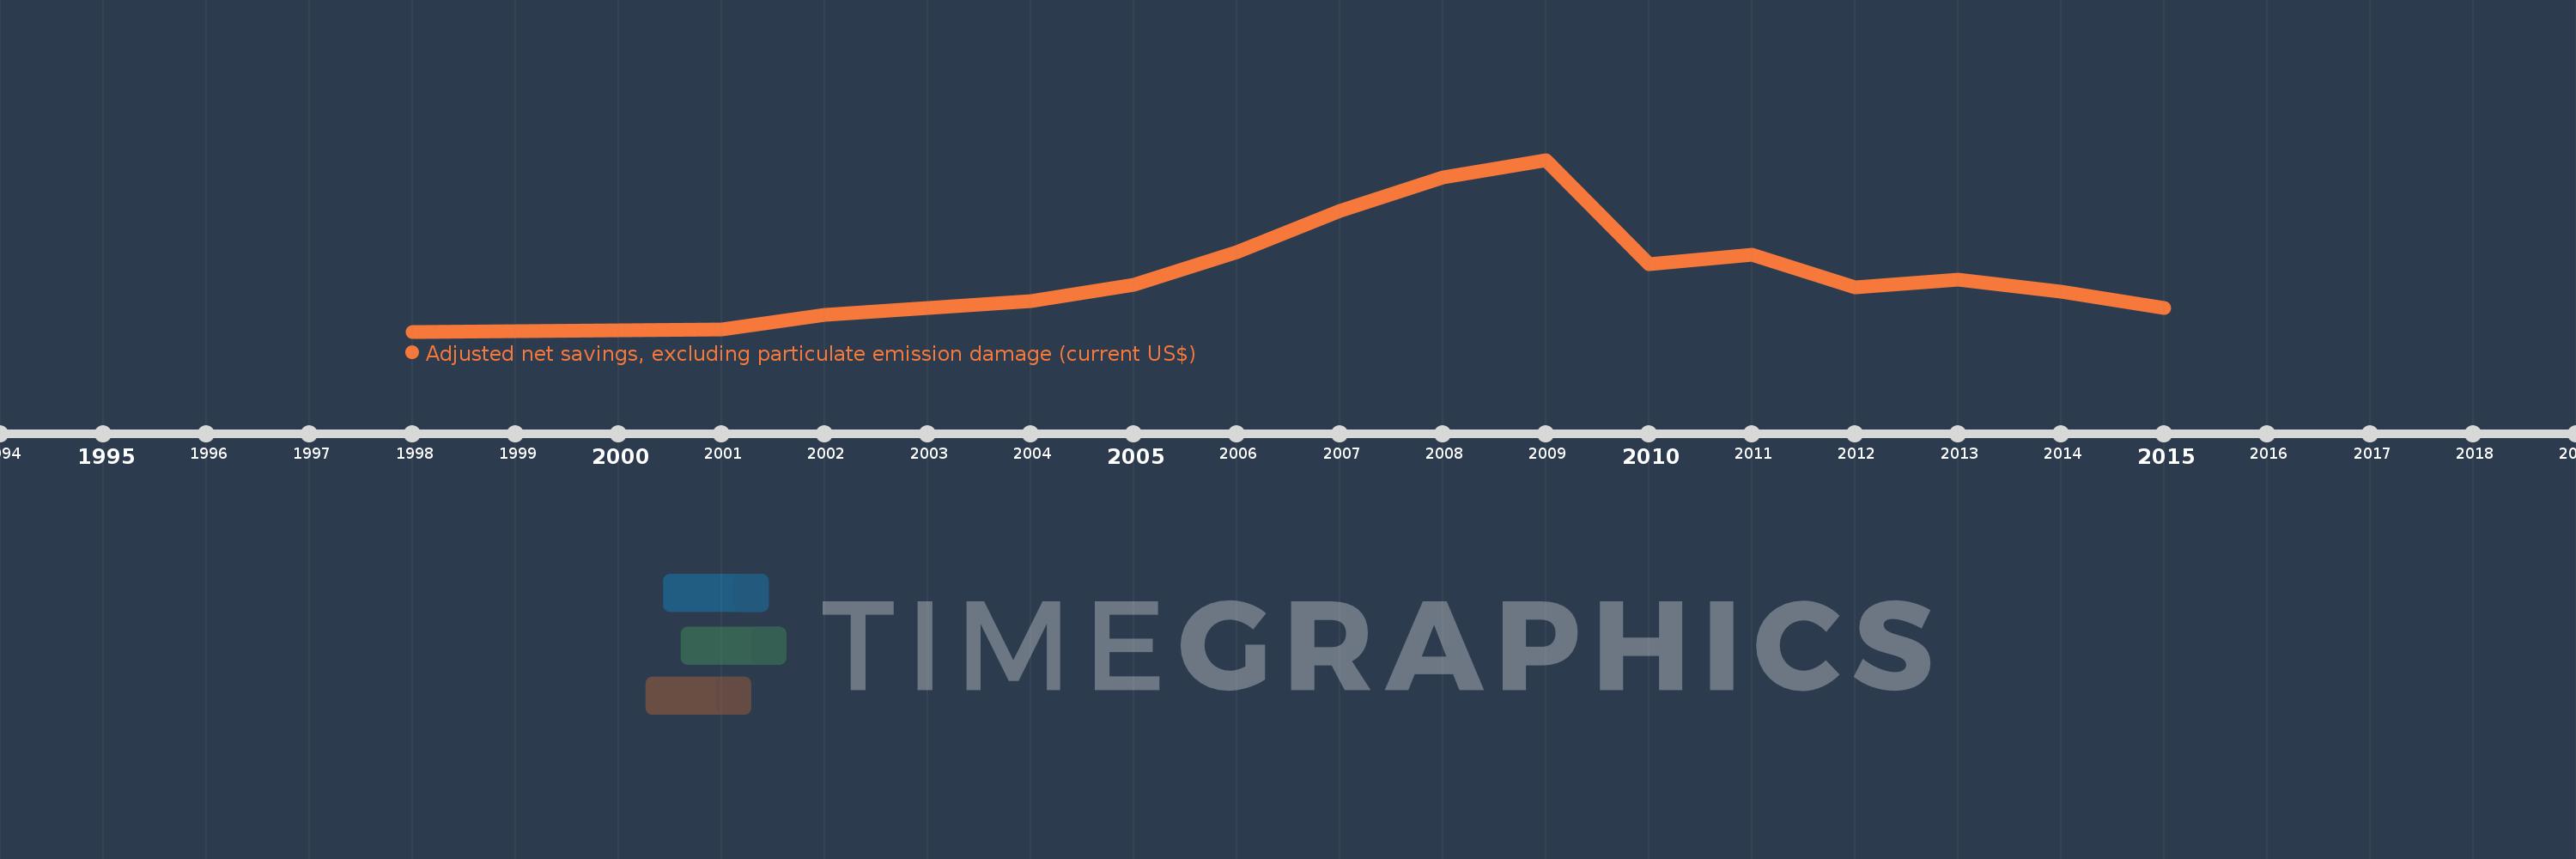
This timeline shows a graph from 1998 to 2015 of Armenia. No data until 1997. Number of actual observations by date: 16.
Source name:
World Development Indicators
Source organization:
World Bank staff estimates based on sources and methods in World Bank's "The Changing Wealth of Nations: Measuring Sustainable Development in the New Millennium" (2011).
Categories, topics:
Economy & Growth, Environment
Last updated:
apr 23, 2017
Indicators value changes by year
Meaning:
613.94 mln
Minimum:
-233.089 mln
jan 1, 1998
Maximum:
2.219 bln
jan 1, 2009
At the date of observation
Value
Absolute change
Change from the previous value
jan 1, 1998
-233.089 mln
-233.089 mln
0.0%
jan 1, 2001
-199.111 mln
+33.979 mln
-14.58%
jan 1, 2002
2.434 mln
+201.544 mln
-101.22%
jan 1, 2003
99.711 mln
+97.277 mln
4.0K%
jan 1, 2004
199.603 mln
+99.892 mln
100.18%
jan 1, 2005
431.836 mln
+232.233 mln
116.35%
jan 1, 2006
897.639 mln
+465.803 mln
107.87%
jan 1, 2007
1.491 bln
+593.801 mln
66.15%
jan 1, 2008
1.967 bln
+475.092 mln
31.85%
jan 1, 2009
2.219 bln
+251.989 mln
12.81%
jan 1, 2010
735.009 mln
-1.484 bln
-66.87%
jan 1, 2011
860.632 mln
+125.624 mln
17.09%
jan 1, 2012
404.136 mln
-456.497 mln
-53.04%
jan 1, 2013
510.423 mln
+106.287 mln
26.3%
jan 1, 2014
330.939 mln
-179.484 mln
-35.16%
jan 1, 2015
106.388 mln
-224.551 mln
-67.85%
Ranking of countries by current statistics by years