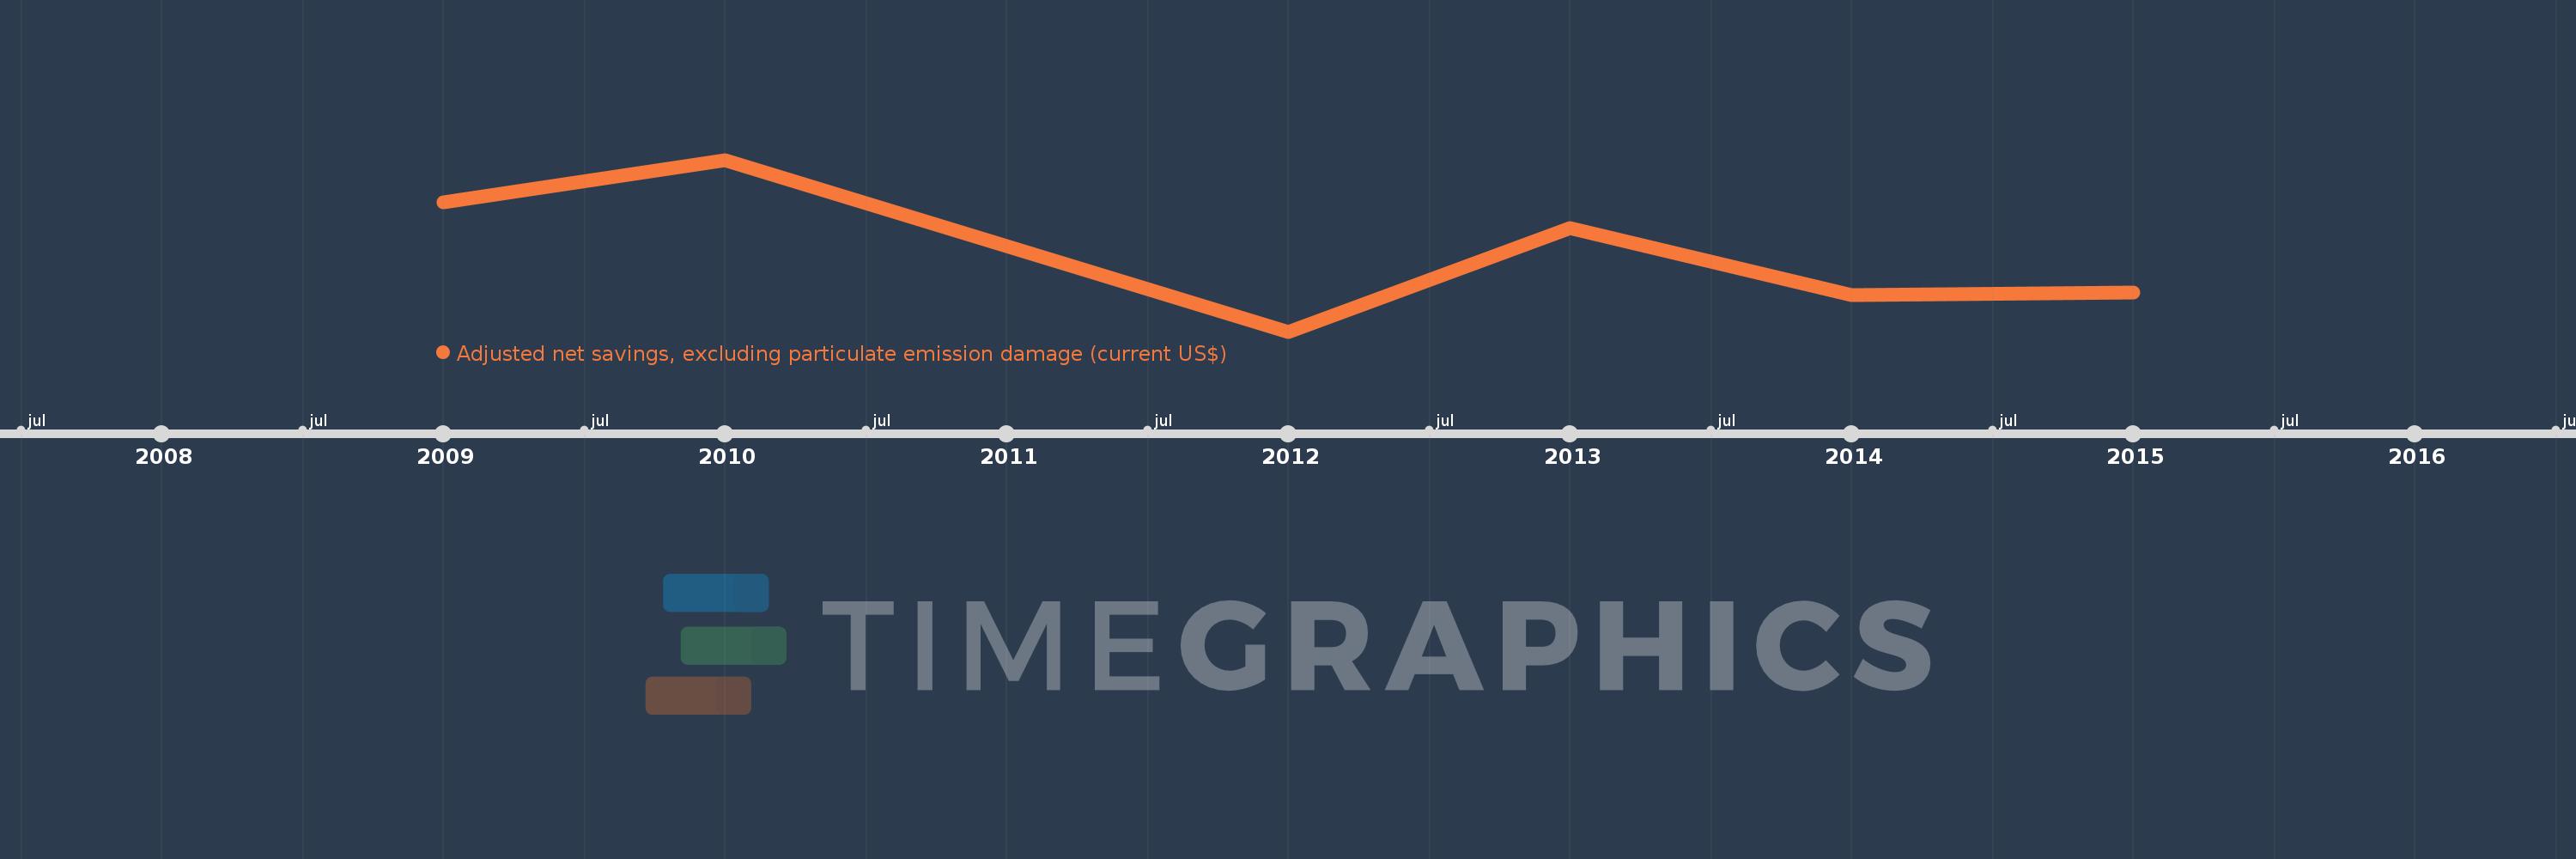
This timeline shows a graph from 2009 to 2015 of Afghanistan. No data until 2008. Number of actual observations by date: 7.
Source name:
World Development Indicators
Source organization:
World Bank staff estimates based on sources and methods in World Bank's "The Changing Wealth of Nations: Measuring Sustainable Development in the New Millennium" (2011).
Categories, topics:
Economy & Growth, Environment
Last updated:
apr 23, 2017
Indicators value changes by year
Meaning:
-2.508 bln
Minimum:
-3.838 bln
jan 1, 2012
Maximum:
-1.012 bln
jan 1, 2010
At the date of observation
Value
Absolute change
Change from the previous value
jan 1, 2009
-1.714 bln
-1.714 bln
0.0%
jan 1, 2010
-1.012 bln
+702.291 mln
-40.97%
jan 1, 2011
-2.427 bln
-1.415 bln
139.87%
jan 1, 2012
-3.838 bln
-1.41 bln
58.1%
jan 1, 2013
-2.131 bln
+1.706 bln
-44.46%
jan 1, 2014
-3.231 bln
-1.099 bln
51.58%
jan 1, 2015
-3.202 bln
+29.09 mln
-0.9%
Ranking of countries by current statistics by years