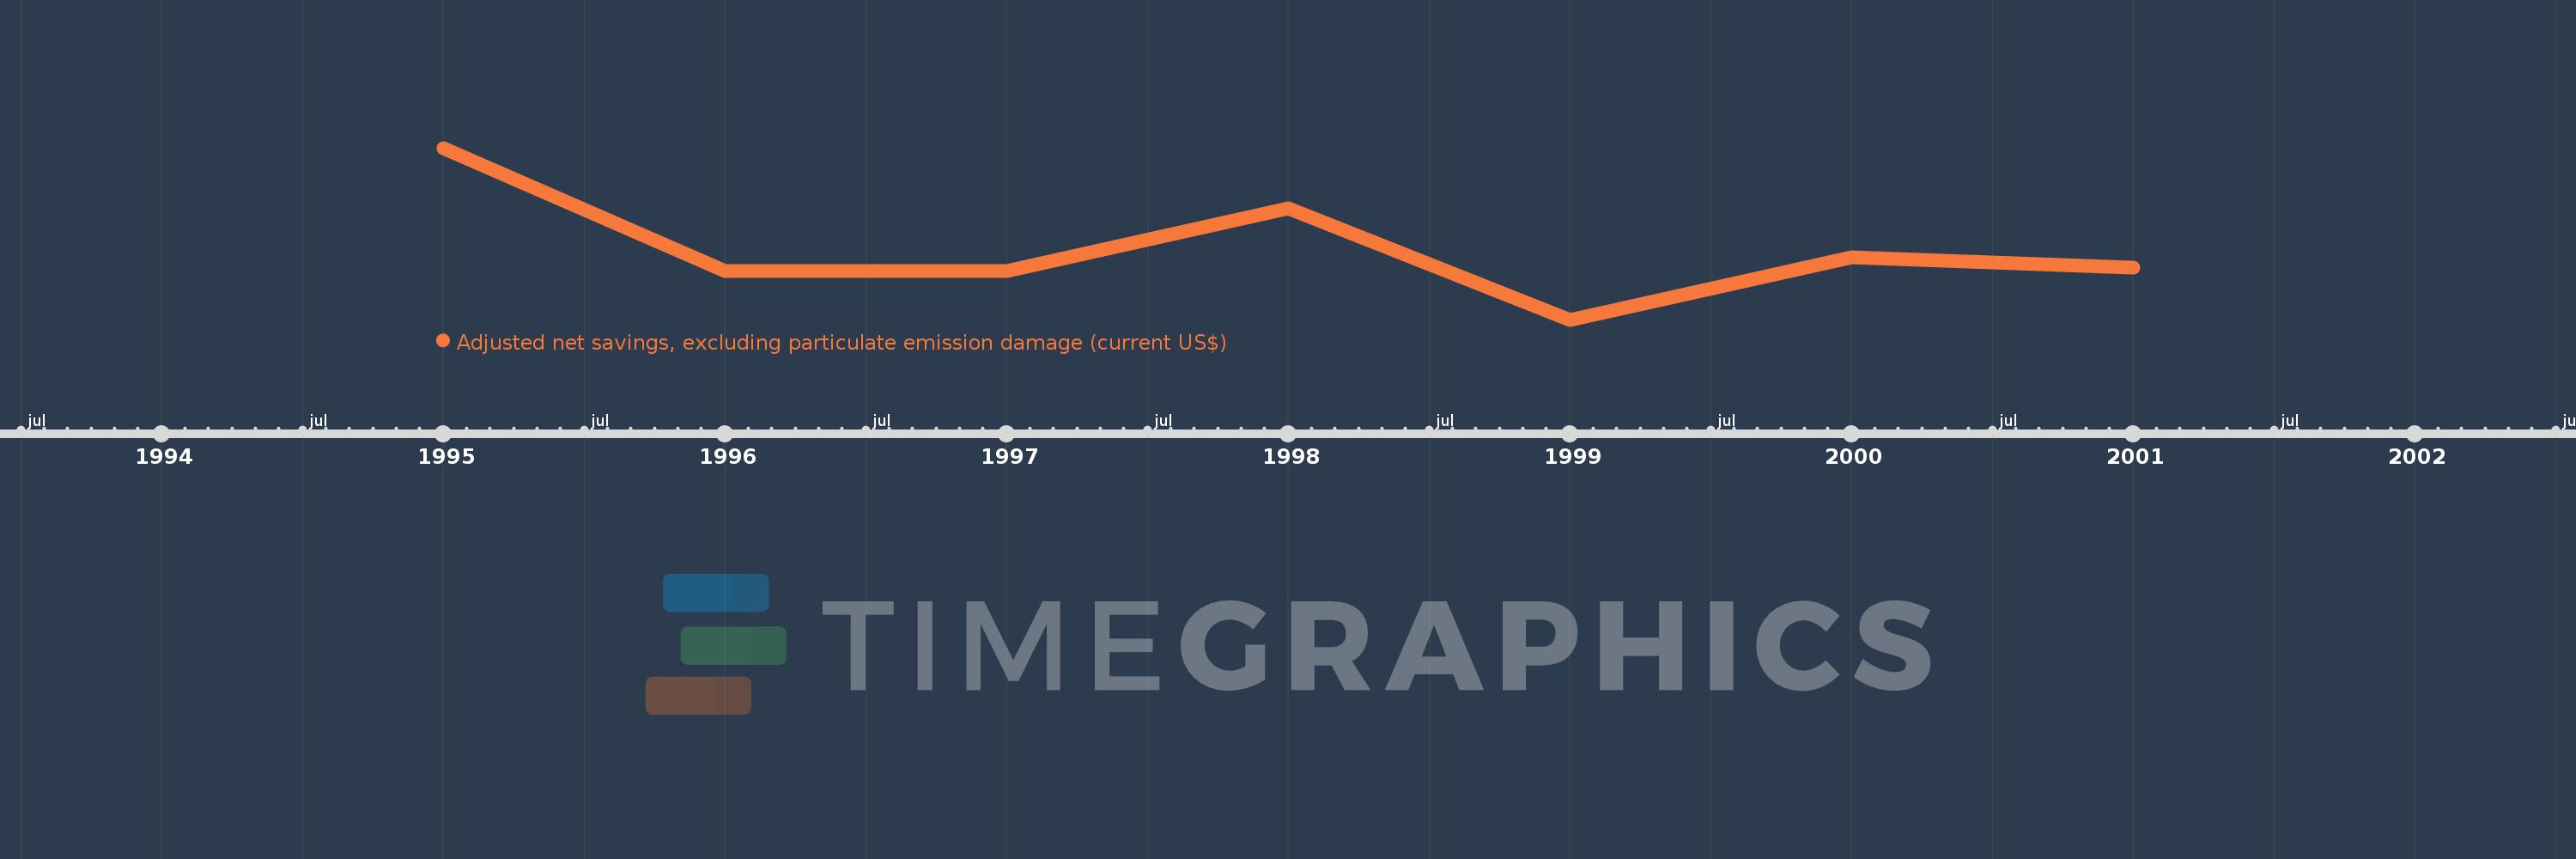
This timeline shows a graph from 1995 to 2001 of Eritrea. No data until 1994. Number of actual observations by date: 7.
Source name:
World Development Indicators
Source organization:
World Bank staff estimates based on sources and methods in World Bank's "The Changing Wealth of Nations: Measuring Sustainable Development in the New Millennium" (2011).
Categories, topics:
Economy & Growth, Environment
Last updated:
apr 23, 2017
Indicators value changes by year
Meaning:
55.236 mln
Minimum:
-59.38 mln
jan 1, 1999
Maximum:
219.677 mln
jan 1, 1995
At the date of observation
Value
Absolute change
Change from the previous value
jan 1, 1995
219.677 mln
+219.677 mln
0.0%
jan 1, 1996
19.39 mln
-200.287 mln
-91.17%
jan 1, 1997
19.667 mln
+277.245K
1.43%
jan 1, 1998
121.031 mln
+101.363 mln
515.4%
jan 1, 1999
-59.38 mln
-180.41 mln
-149.06%
jan 1, 2000
41.605 mln
+100.985 mln
-170.07%
jan 1, 2001
24.665 mln
-16.94 mln
-40.72%
Ranking of countries by current statistics by years