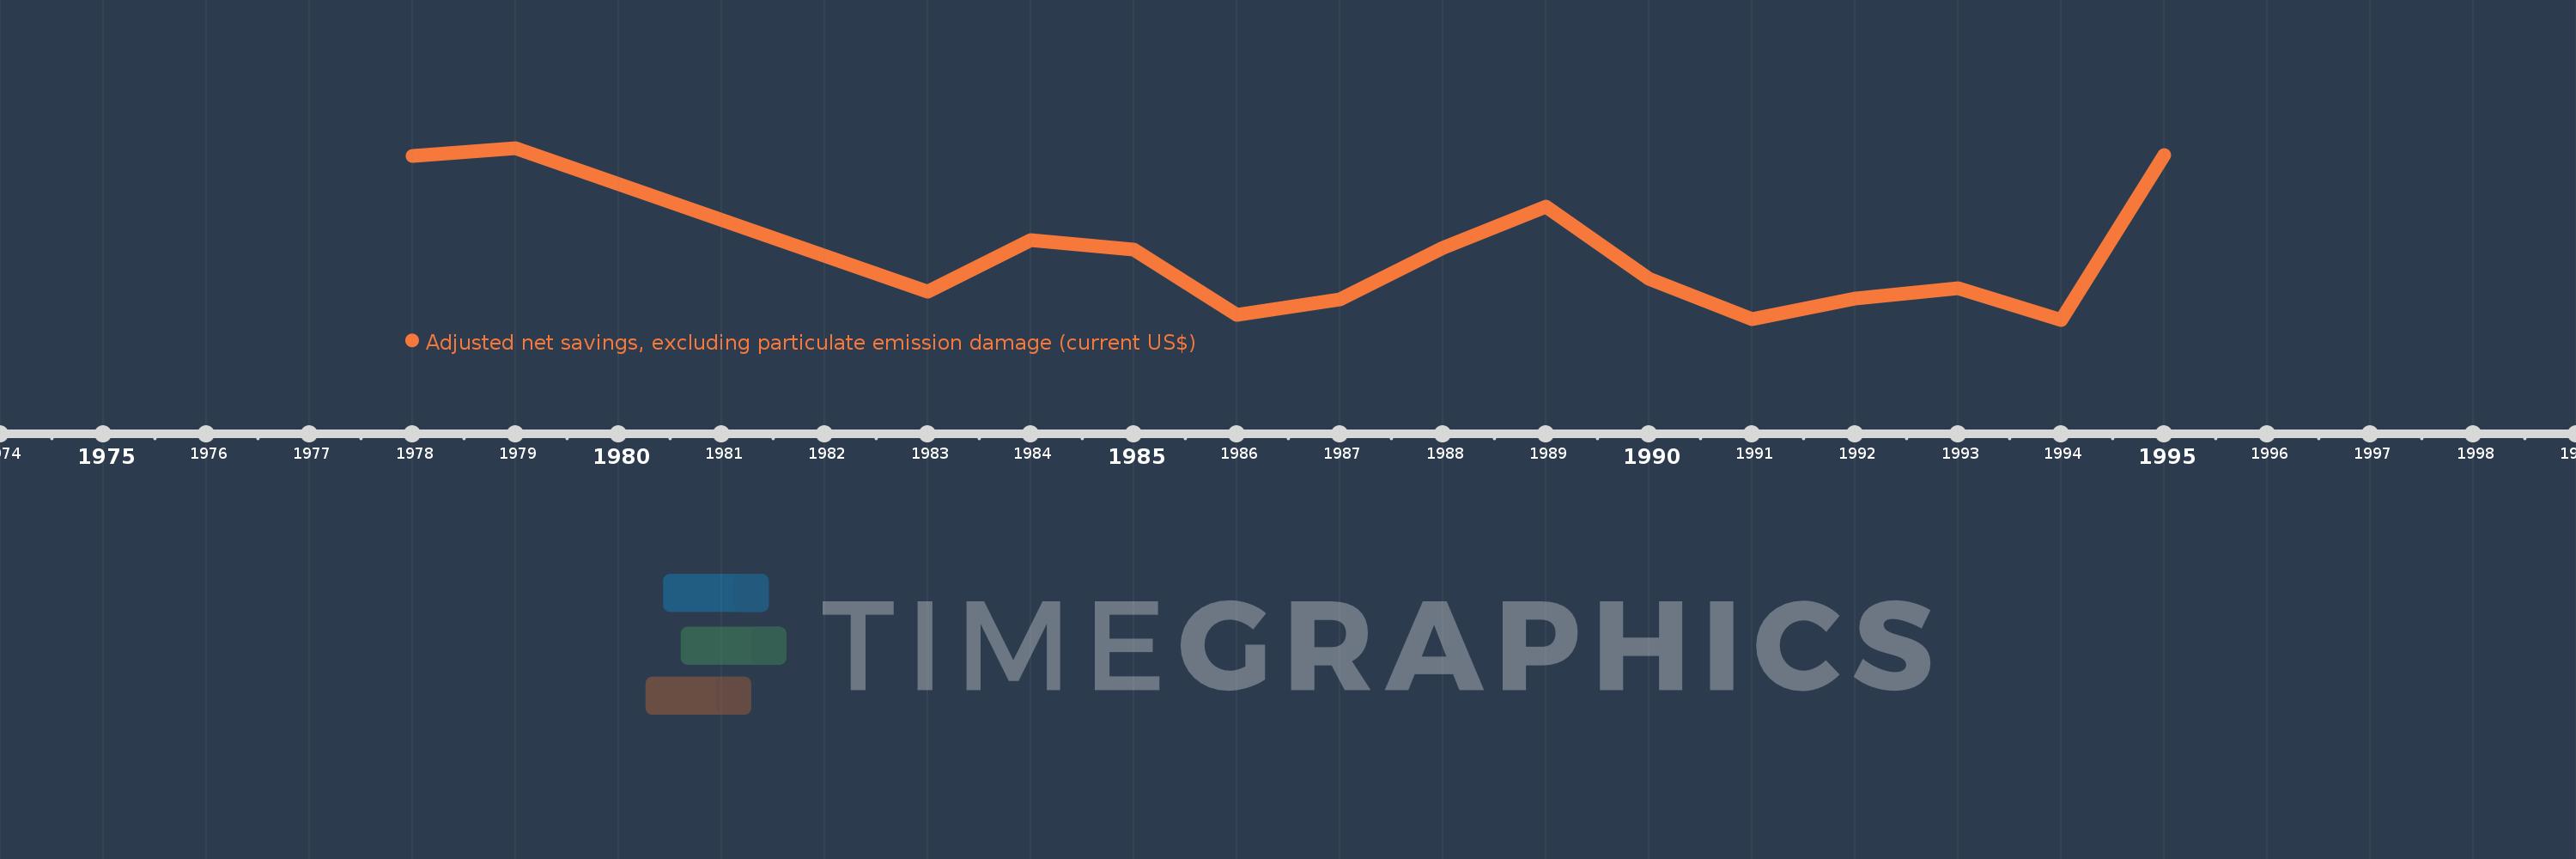
This timeline shows a graph from 1978 to 1995 of Chad. No data until 1977. Number of actual observations by date: 15.
Source name:
World Development Indicators
Source organization:
World Bank staff estimates based on sources and methods in World Bank's "The Changing Wealth of Nations: Measuring Sustainable Development in the New Millennium" (2011).
Categories, topics:
Economy & Growth, Environment
Last updated:
apr 23, 2017
Indicators value changes by year
Meaning:
9.813 mln
Minimum:
-48.401 mln
jan 1, 1994
Maximum:
104.421 mln
jan 1, 1979
At the date of observation
Value
Absolute change
Change from the previous value
jan 1, 1978
97.113 mln
+97.113 mln
0.0%
jan 1, 1979
104.421 mln
+7.308 mln
7.53%
jan 1, 1983
-23.433 mln
-127.854 mln
-122.44%
jan 1, 1984
22.325 mln
+45.757 mln
-195.27%
jan 1, 1985
13.856 mln
-8.469 mln
-37.94%
jan 1, 1986
-44.092 mln
-57.948 mln
-418.23%
jan 1, 1987
-30.424 mln
+13.669 mln
-31.0%
jan 1, 1988
15.712 mln
+46.136 mln
-151.64%
jan 1, 1989
51.954 mln
+36.242 mln
230.66%
jan 1, 1990
-12.259 mln
-64.213 mln
-123.6%
jan 1, 1991
-47.639 mln
-35.379 mln
288.59%
jan 1, 1992
-29.291 mln
+18.348 mln
-38.51%
jan 1, 1993
-20.351 mln
+8.94 mln
-30.52%
jan 1, 1994
-48.401 mln
-28.051 mln
137.84%
jan 1, 1995
97.707 mln
+146.109 mln
-301.87%
Ranking of countries by current statistics by years