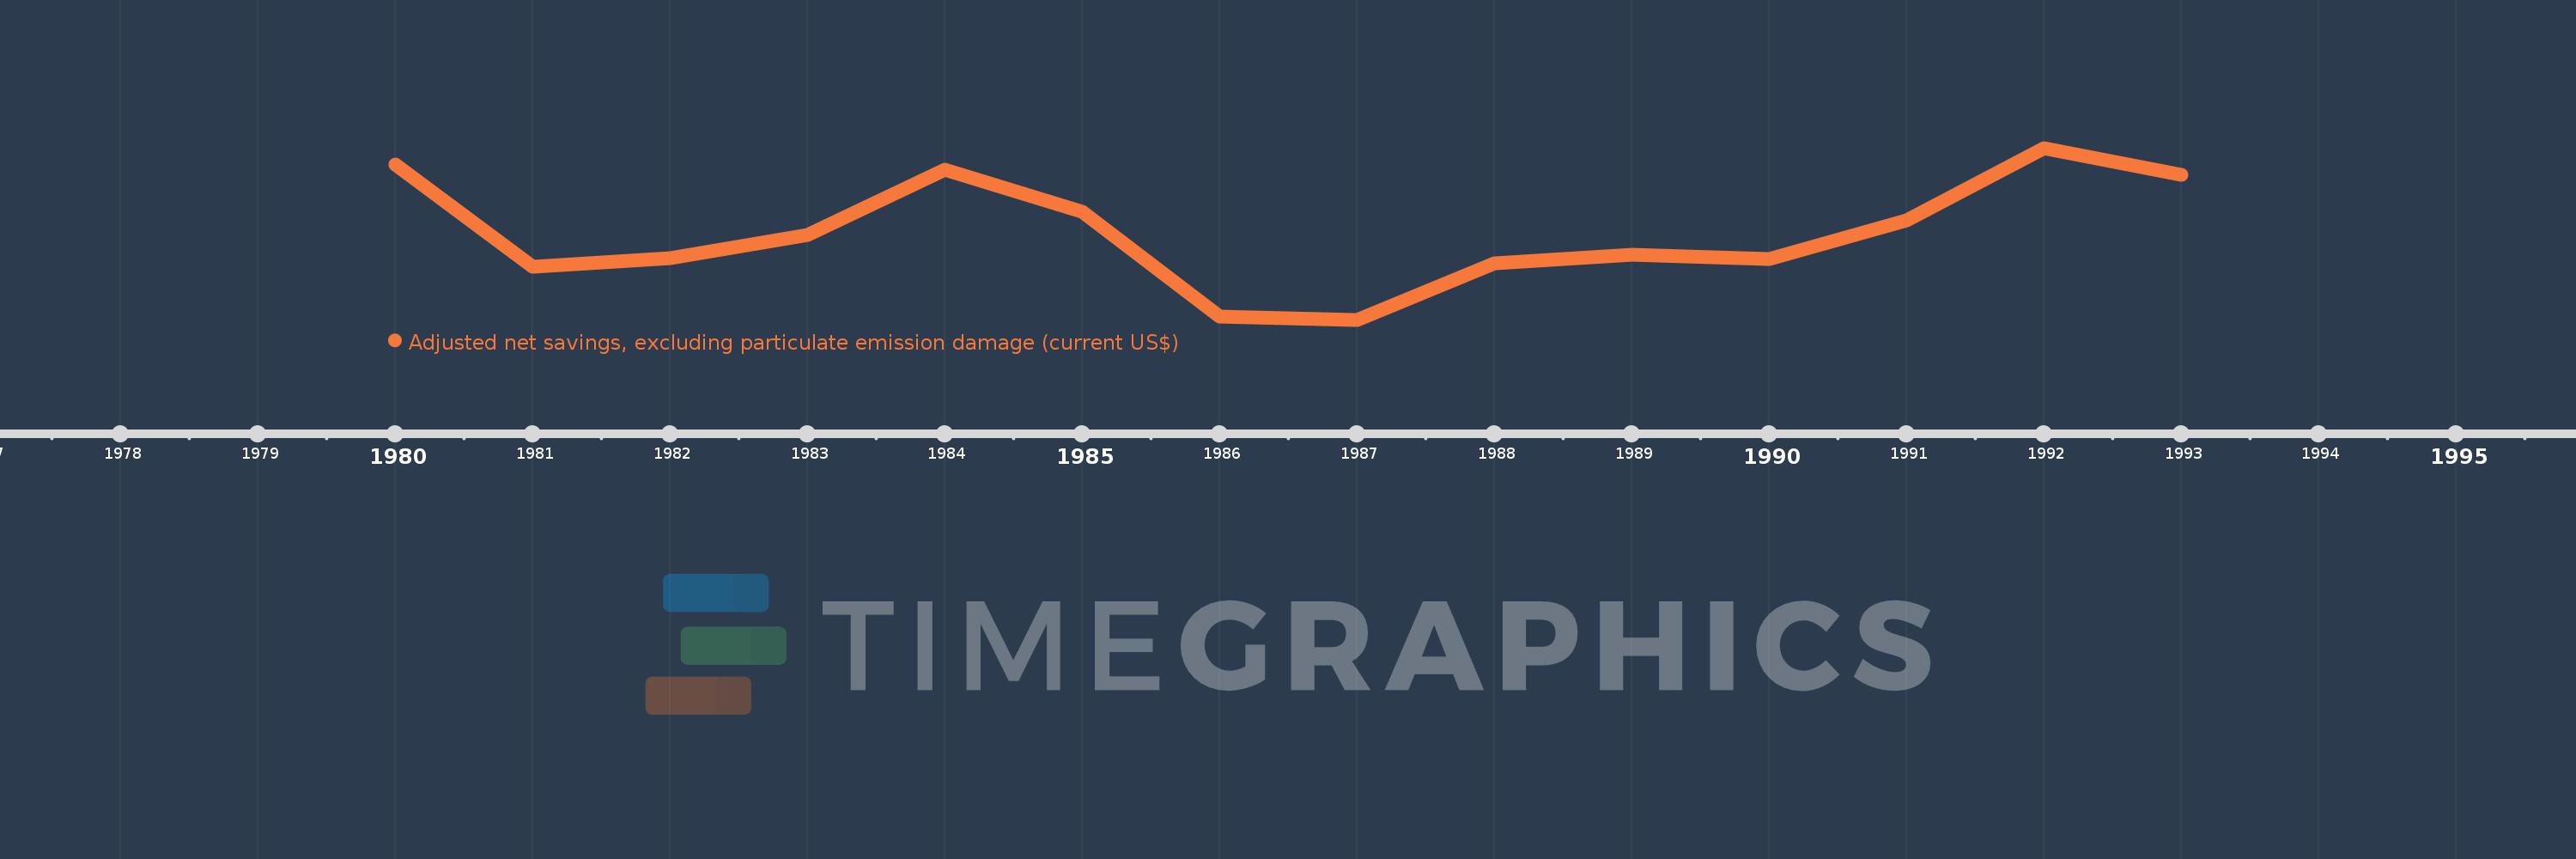
This timeline shows a graph from 1980 to 1993 of Kiribati. No data until 1979. Number of actual observations by date: 14.
Source name:
World Development Indicators
Source organization:
World Bank staff estimates based on sources and methods in World Bank's "The Changing Wealth of Nations: Measuring Sustainable Development in the New Millennium" (2011).
Categories, topics:
Economy & Growth, Environment
Last updated:
apr 23, 2017
Indicators value changes by year
Meaning:
16.058 mln
Minimum:
5.256 mln
jan 1, 1987
Maximum:
26.623 mln
jan 1, 1992
At the date of observation
Value
Absolute change
Change from the previous value
jan 1, 1980
24.535 mln
+24.535 mln
0.0%
jan 1, 1981
11.888 mln
-12.647 mln
-51.55%
jan 1, 1982
12.953 mln
+1.065 mln
8.96%
jan 1, 1983
15.844 mln
+2.891 mln
22.32%
jan 1, 1984
23.963 mln
+8.12 mln
51.25%
jan 1, 1985
18.687 mln
-5.276 mln
-22.02%
jan 1, 1986
5.644 mln
-13.044 mln
-69.8%
jan 1, 1987
5.256 mln
-387.15K
-6.86%
jan 1, 1988
12.269 mln
+7.012 mln
133.41%
jan 1, 1989
13.379 mln
+1.11 mln
9.05%
jan 1, 1990
12.862 mln
-516.471K
-3.86%
jan 1, 1991
17.571 mln
+4.708 mln
36.61%
jan 1, 1992
26.623 mln
+9.052 mln
51.52%
jan 1, 1993
23.332 mln
-3.291 mln
-12.36%
Ranking of countries by current statistics by years