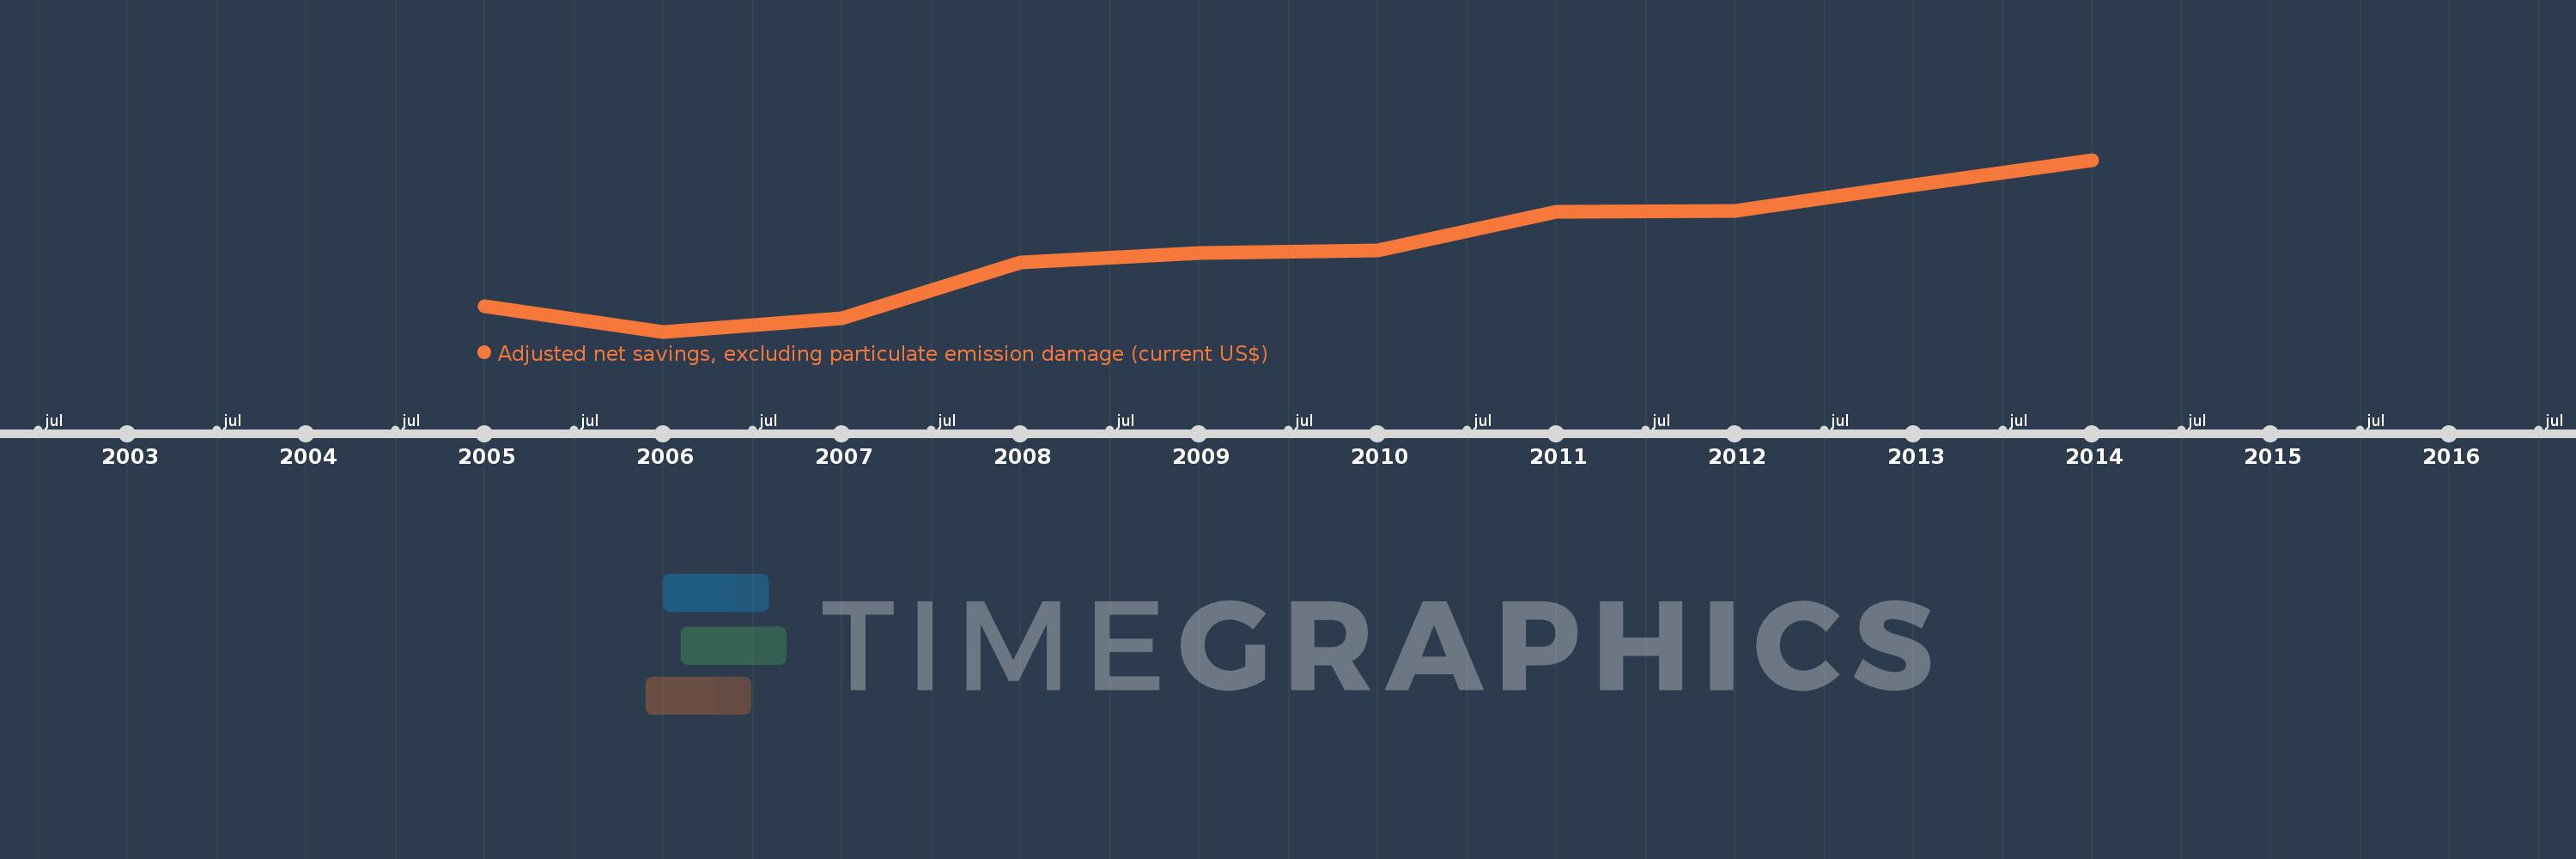
This timeline shows a graph from 2005 to 2014 of Tajikistan. No data until 2004. Number of actual observations by date: 10.
Source name:
World Development Indicators
Source organization:
World Bank staff estimates based on sources and methods in World Bank's "The Changing Wealth of Nations: Measuring Sustainable Development in the New Millennium" (2011).
Categories, topics:
Economy & Growth, Environment
Last updated:
apr 23, 2017
Indicators value changes by year
Meaning:
407.614 mln
Minimum:
-372.501 mln
jan 1, 2006
Maximum:
1.25 bln
jan 1, 2014
At the date of observation
Value
Absolute change
Change from the previous value
jan 1, 2005
-134.758 mln
-134.758 mln
0.0%
jan 1, 2006
-372.501 mln
-237.743 mln
176.42%
jan 1, 2007
-244.643 mln
+127.858 mln
-34.32%
jan 1, 2008
282.895 mln
+527.538 mln
-215.64%
jan 1, 2009
367.625 mln
+84.73 mln
29.95%
jan 1, 2010
391.063 mln
+23.438 mln
6.38%
jan 1, 2011
757.43 mln
+366.367 mln
93.68%
jan 1, 2012
767.986 mln
+10.556 mln
1.39%
jan 1, 2013
1.011 bln
+243.207 mln
31.67%
jan 1, 2014
1.25 bln
+238.652 mln
23.6%
Ranking of countries by current statistics by years