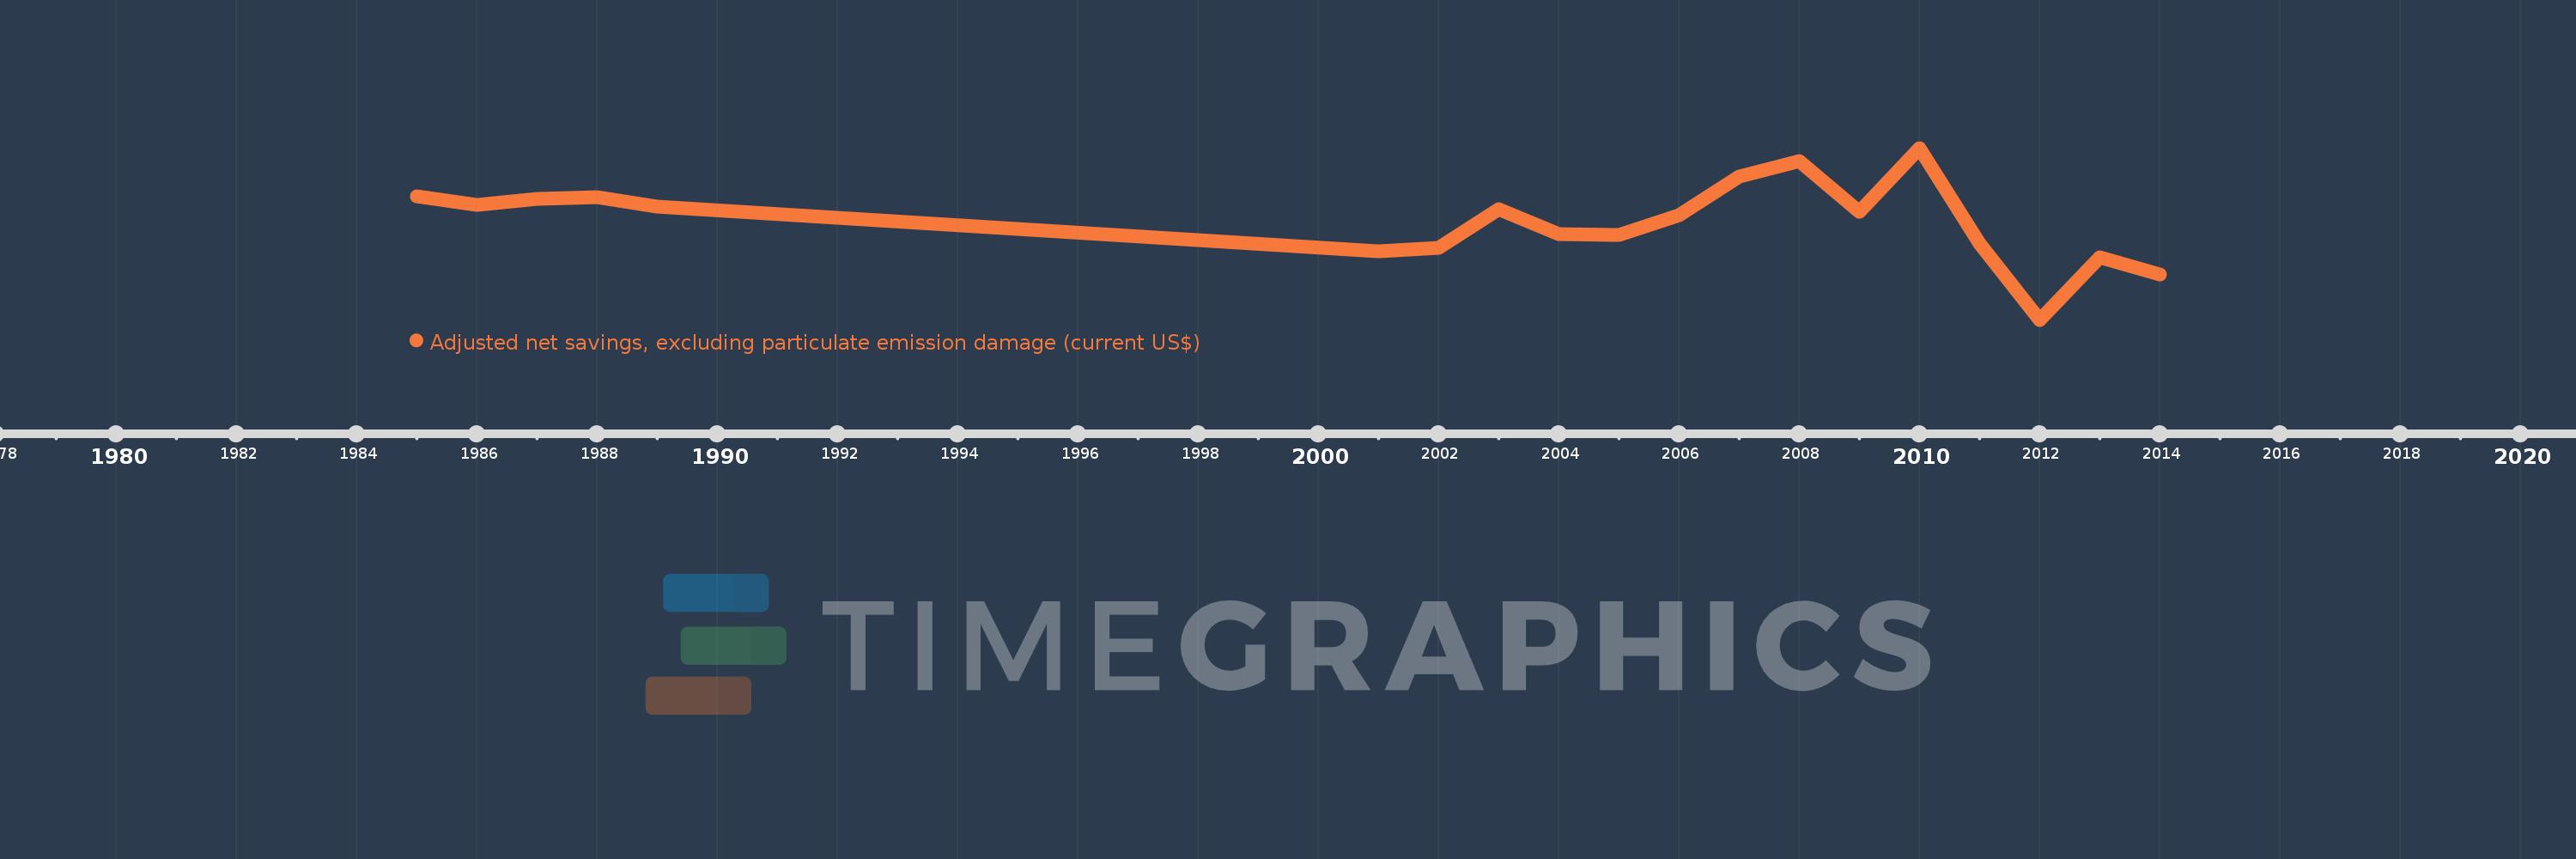
This timeline shows a graph from 1985 to 2014 of Lao PDR. No data until 1984. Number of actual observations by date: 19.
Source name:
World Development Indicators
Source organization:
World Bank staff estimates based on sources and methods in World Bank's "The Changing Wealth of Nations: Measuring Sustainable Development in the New Millennium" (2011).
Categories, topics:
Economy & Growth, Environment
Last updated:
apr 23, 2017
Indicators value changes by year
Meaning:
-127.373 mln
Minimum:
-491.101 mln
jan 1, 2012
Maximum:
137.809 mln
jan 1, 2010
At the date of observation
Value
Absolute change
Change from the previous value
jan 1, 1985
-37.663 mln
-37.663 mln
0.0%
jan 1, 1986
-70.781 mln
-33.119 mln
87.93%
jan 1, 1987
-47.117 mln
+23.664 mln
-33.43%
jan 1, 1988
-42.37 mln
+4.748 mln
-10.08%
jan 1, 1989
-76.107 mln
-33.738 mln
79.63%
jan 1, 2001
-240.824 mln
-164.717 mln
216.43%
jan 1, 2002
-226.656 mln
+14.168 mln
-5.88%
jan 1, 2003
-86.017 mln
+140.639 mln
-62.05%
jan 1, 2004
-177.1 mln
-91.083 mln
105.89%
jan 1, 2005
-181.505 mln
-4.406 mln
2.49%
jan 1, 2006
-107.105 mln
+74.4 mln
-40.99%
jan 1, 2007
32.923 mln
+140.028 mln
-130.74%
jan 1, 2008
89.829 mln
+56.906 mln
172.85%
jan 1, 2009
-96.798 mln
-186.627 mln
-207.76%
jan 1, 2010
137.809 mln
+234.607 mln
-242.37%
jan 1, 2011
-211.667 mln
-349.476 mln
-253.6%
jan 1, 2012
-491.101 mln
-279.434 mln
132.02%
jan 1, 2013
-263.165 mln
+227.937 mln
-46.41%
jan 1, 2014
-324.674 mln
-61.509 mln
23.37%
Ranking of countries by current statistics by years