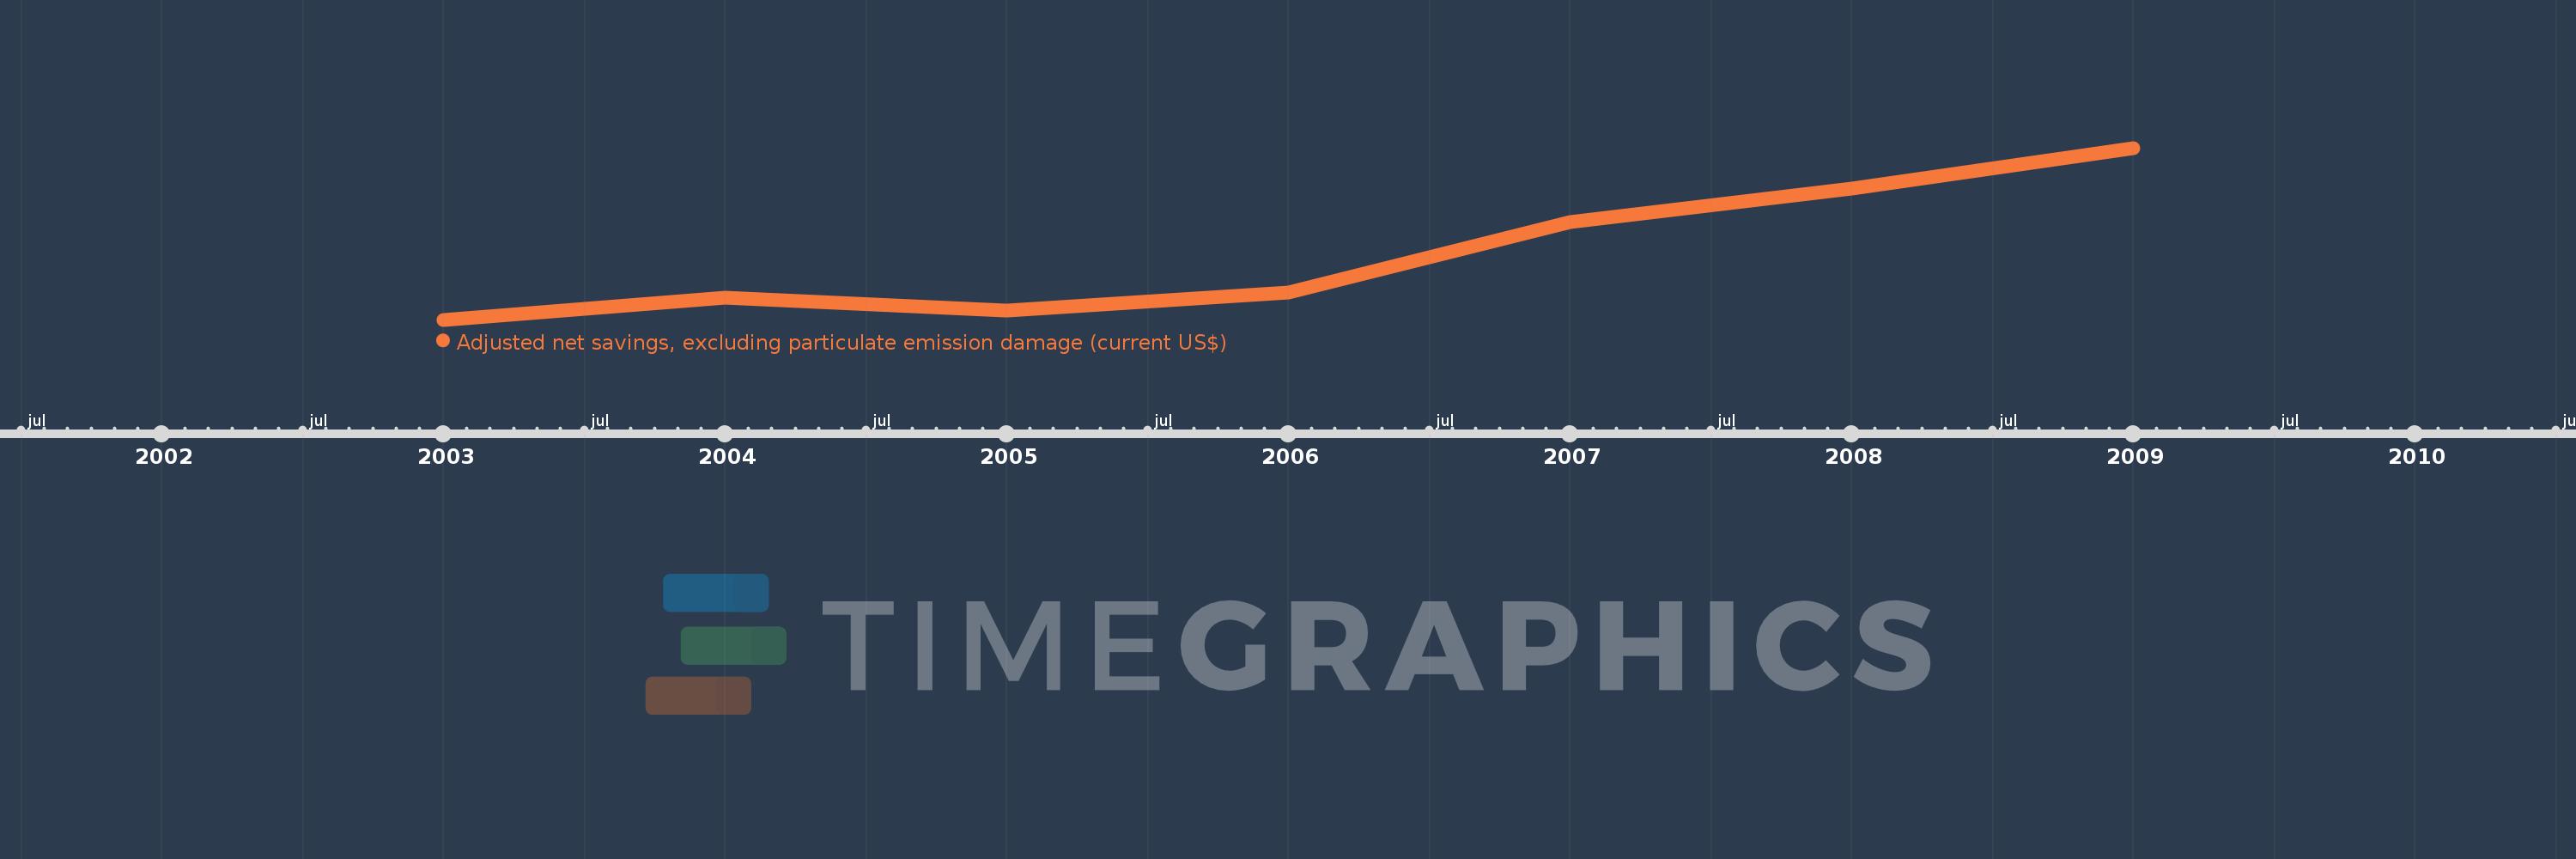
This timeline shows a graph from 2003 to 2009 of Libya. No data until 2002. Number of actual observations by date: 7.
Source name:
World Development Indicators
Source organization:
World Bank staff estimates based on sources and methods in World Bank's "The Changing Wealth of Nations: Measuring Sustainable Development in the New Millennium" (2011).
Categories, topics:
Economy & Growth, Environment
Last updated:
apr 23, 2017
Indicators value changes by year
Meaning:
10.333 bln
Minimum:
-1.942 bln
jan 1, 2003
Maximum:
30.193 bln
jan 1, 2009
At the date of observation
Value
Absolute change
Change from the previous value
jan 1, 2003
-1.942 bln
-1.942 bln
0.0%
jan 1, 2004
2.193 bln
+4.135 bln
-212.94%
jan 1, 2005
-202.414 mln
-2.395 bln
-109.23%
jan 1, 2006
3.222 bln
+3.424 bln
-1.69K%
jan 1, 2007
16.252 bln
+13.03 bln
404.44%
jan 1, 2008
22.616 bln
+6.364 bln
39.16%
jan 1, 2009
30.193 bln
+7.577 bln
33.5%
Ranking of countries by current statistics by years