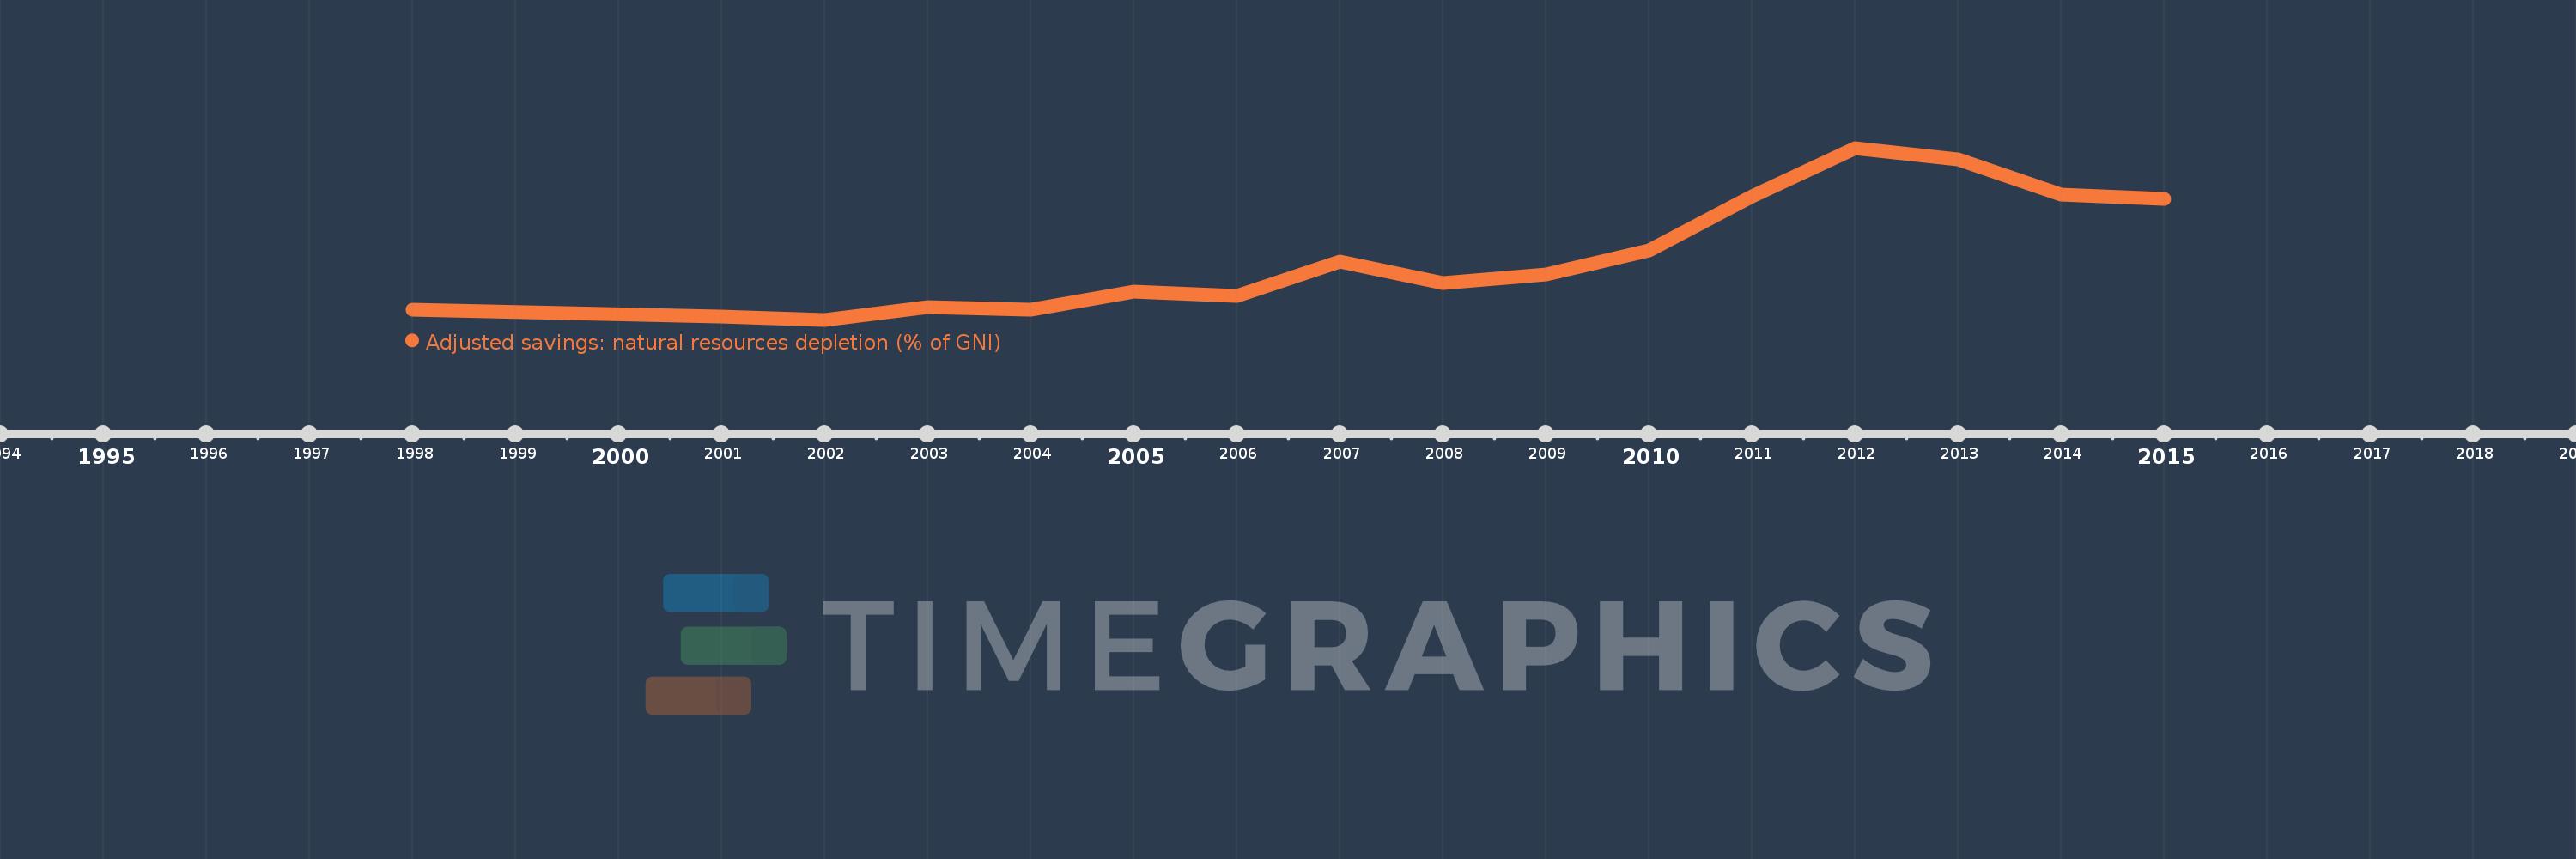
This timeline shows a graph from 1998 to 2015 of Armenia. No data until 1997. Number of actual observations by date: 16.
Source name:
World Development Indicators
Source organization:
World Bank staff estimates based on sources and methods in World Bank's "The Changing Wealth of Nations: Measuring Sustainable Development in the New Millennium" (2011).
Categories, topics:
Economy & Growth, Energy & Mining
Last updated:
apr 23, 2017
Indicators value changes by year
Meaning:
0.984
Minimum:
0.141
jan 1, 2002
Maximum:
2.462
jan 1, 2012
At the date of observation
Value
Absolute change
Change from the previous value
jan 1, 1998
0.277
+0.277
0.0%
jan 1, 2001
0.186
-0.092
-33.01%
jan 1, 2002
0.141
-0.044
-23.94%
jan 1, 2003
0.307
+0.166
117.47%
jan 1, 2004
0.271
-0.037
-11.99%
jan 1, 2005
0.522
+0.252
92.97%
jan 1, 2006
0.463
-0.059
-11.29%
jan 1, 2007
0.921
+0.458
98.93%
jan 1, 2008
0.637
-0.284
-30.83%
jan 1, 2009
0.758
+0.121
18.92%
jan 1, 2010
1.075
+0.317
41.78%
jan 1, 2011
1.811
+0.736
68.48%
jan 1, 2012
2.462
+0.651
35.98%
jan 1, 2013
2.312
-0.15
-6.1%
jan 1, 2014
1.829
-0.482
-20.86%
jan 1, 2015
1.774
-0.055
-3.01%
Ranking of countries by current statistics by years