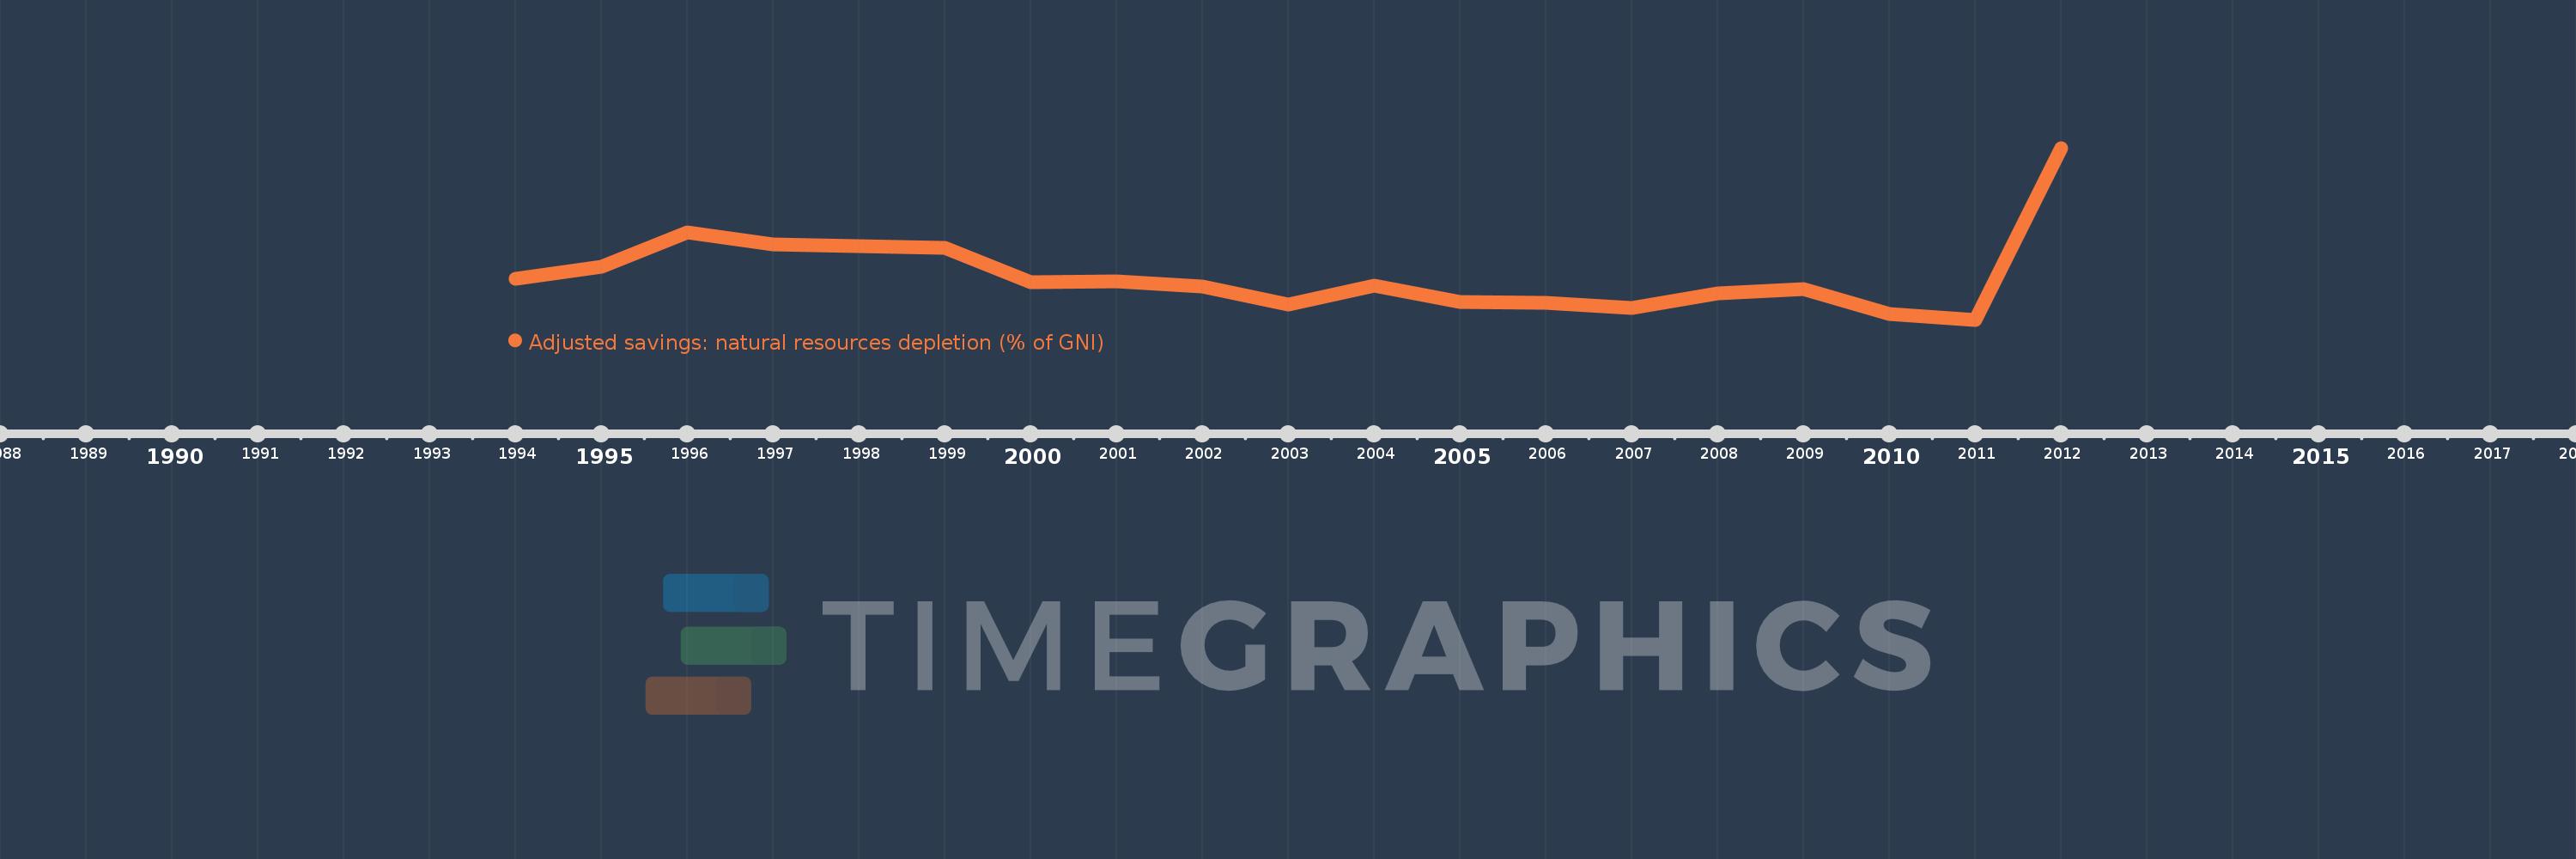
This timeline shows a graph from 1994 to 2012 of Eritrea. No data until 1993. Number of actual observations by date: 19.
Source name:
World Development Indicators
Source organization:
World Bank staff estimates based on sources and methods in World Bank's "The Changing Wealth of Nations: Measuring Sustainable Development in the New Millennium" (2011).
Categories, topics:
Economy & Growth, Energy & Mining
Last updated:
apr 23, 2017
Indicators value changes by year
Meaning:
5.248
Minimum:
1.842
jan 1, 2011
Maximum:
15.052
jan 1, 2012
At the date of observation
Value
Absolute change
Change from the previous value
jan 1, 1994
5.016
+5.016
0.0%
jan 1, 1995
5.903
+0.886
17.67%
jan 1, 1996
8.58
+2.677
45.35%
jan 1, 1997
7.607
-0.973
-11.34%
jan 1, 1998
7.502
-0.105
-1.38%
jan 1, 1999
7.365
-0.136
-1.82%
jan 1, 2000
4.711
-2.655
-36.05%
jan 1, 2001
4.768
+0.057
1.22%
jan 1, 2002
4.429
-0.339
-7.1%
jan 1, 2003
3.03
-1.399
-31.59%
jan 1, 2004
4.441
+1.41
46.54%
jan 1, 2005
3.206
-1.235
-27.81%
jan 1, 2006
3.168
-0.037
-1.17%
jan 1, 2007
2.746
-0.422
-13.33%
jan 1, 2008
3.853
+1.107
40.32%
jan 1, 2009
4.186
+0.333
8.64%
jan 1, 2010
2.316
-1.87
-44.68%
jan 1, 2011
1.842
-0.473
-20.44%
jan 1, 2012
15.052
+13.21
717.02%
Ranking of countries by current statistics by years