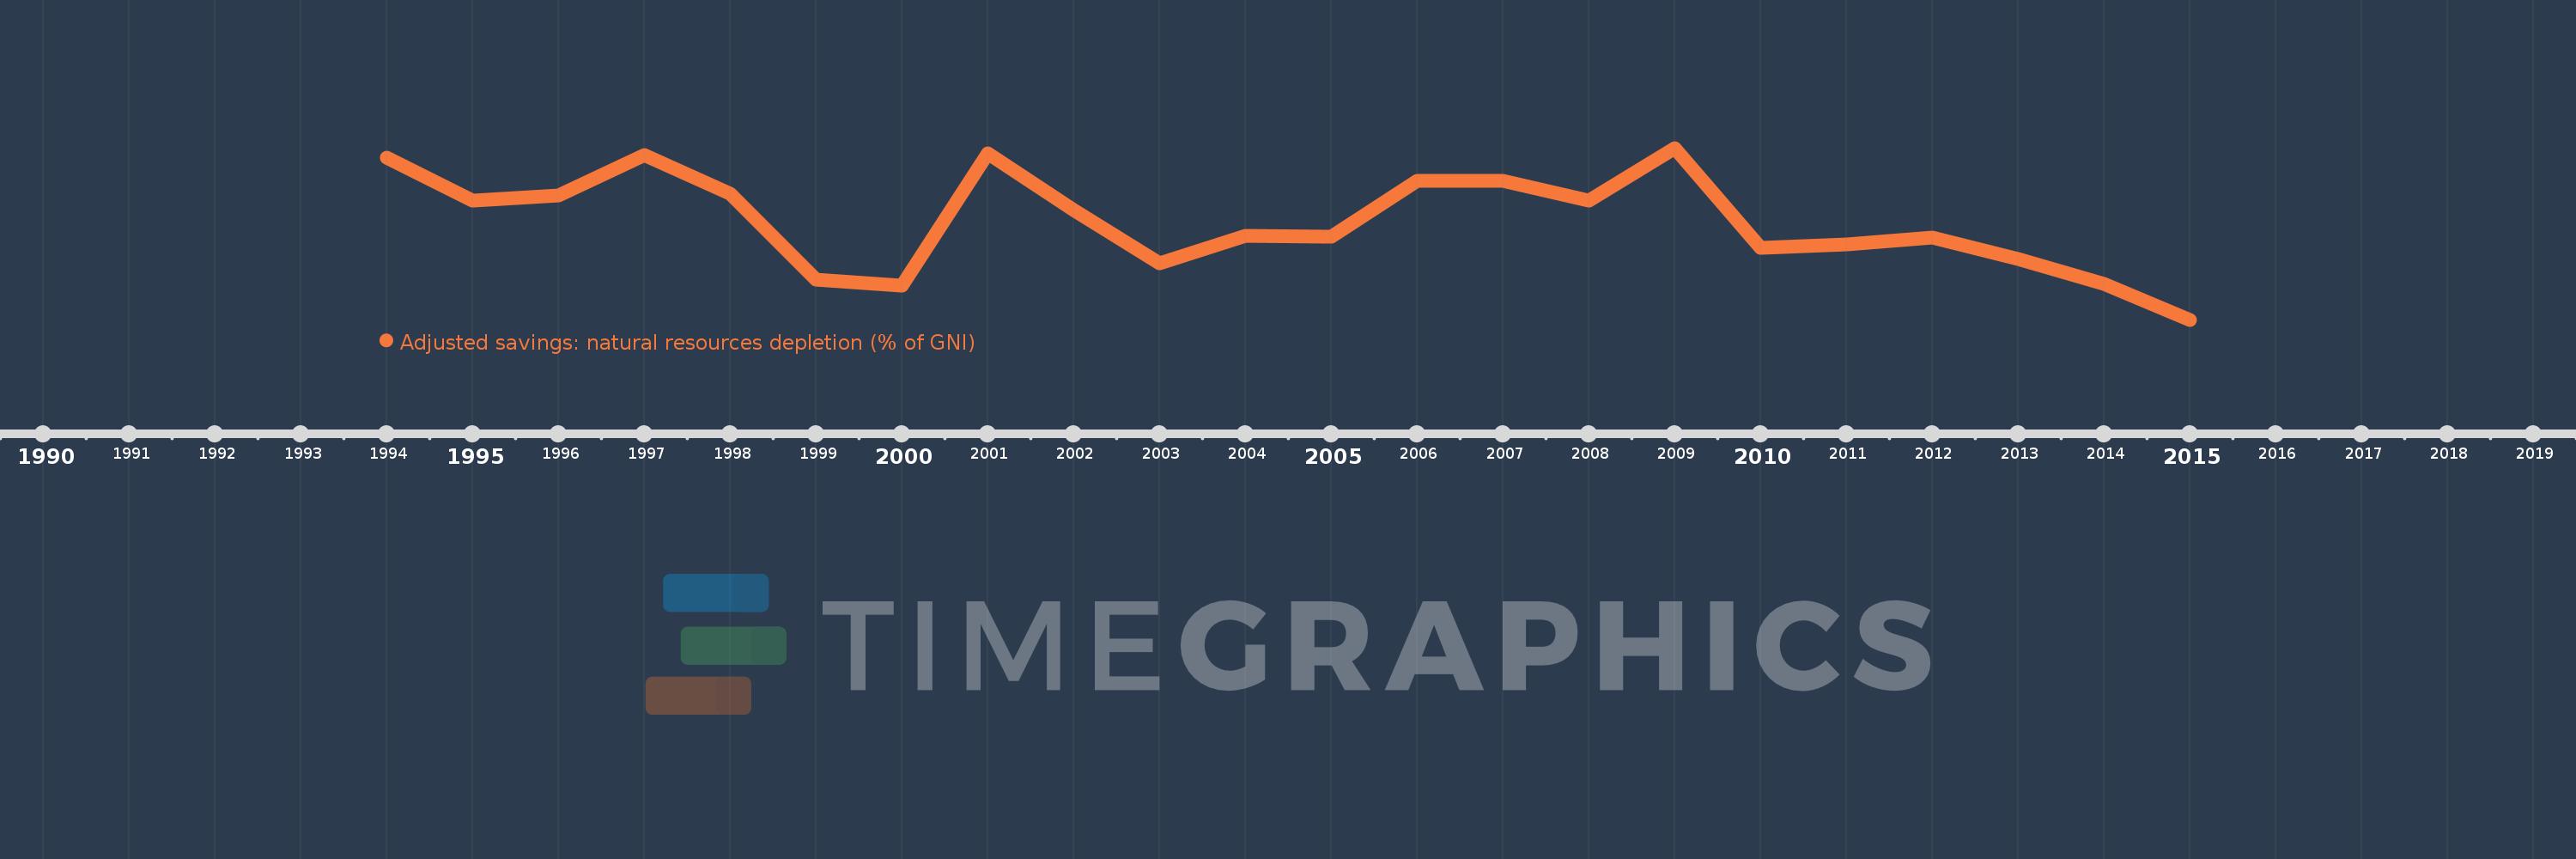
This timeline shows a graph from 1994 to 2015 of Hungary. No data until 1993. Number of actual observations by date: 22.
Source name:
World Development Indicators
Source organization:
World Bank staff estimates based on sources and methods in World Bank's "The Changing Wealth of Nations: Measuring Sustainable Development in the New Millennium" (2011).
Categories, topics:
Economy & Growth, Energy & Mining
Last updated:
apr 23, 2017
Indicators value changes by year
Meaning:
0.584
Minimum:
0.26
jan 1, 2015
Maximum:
0.827
jan 1, 2009
At the date of observation
Value
Absolute change
Change from the previous value
jan 1, 1994
0.795
+0.795
0.0%
jan 1, 1995
0.653
-0.142
-17.88%
jan 1, 1996
0.67
+0.017
2.54%
jan 1, 1997
0.803
+0.134
19.99%
jan 1, 1998
0.677
-0.127
-15.78%
jan 1, 1999
0.391
-0.286
-42.26%
jan 1, 2000
0.372
-0.019
-4.83%
jan 1, 2001
0.809
+0.437
117.56%
jan 1, 2002
0.621
-0.188
-23.22%
jan 1, 2003
0.446
-0.176
-28.26%
jan 1, 2004
0.537
+0.091
20.53%
jan 1, 2005
0.534
-0.003
-0.54%
jan 1, 2006
0.718
+0.184
34.38%
jan 1, 2007
0.719
+0.001
0.15%
jan 1, 2008
0.652
-0.067
-9.32%
jan 1, 2009
0.827
+0.176
26.93%
jan 1, 2010
0.496
-0.332
-40.08%
jan 1, 2011
0.51
+0.014
2.89%
jan 1, 2012
0.532
+0.022
4.34%
jan 1, 2013
0.46
-0.072
-13.6%
jan 1, 2014
0.378
-0.082
-17.88%
jan 1, 2015
0.26
-0.118
-31.13%
Ranking of countries by current statistics by years