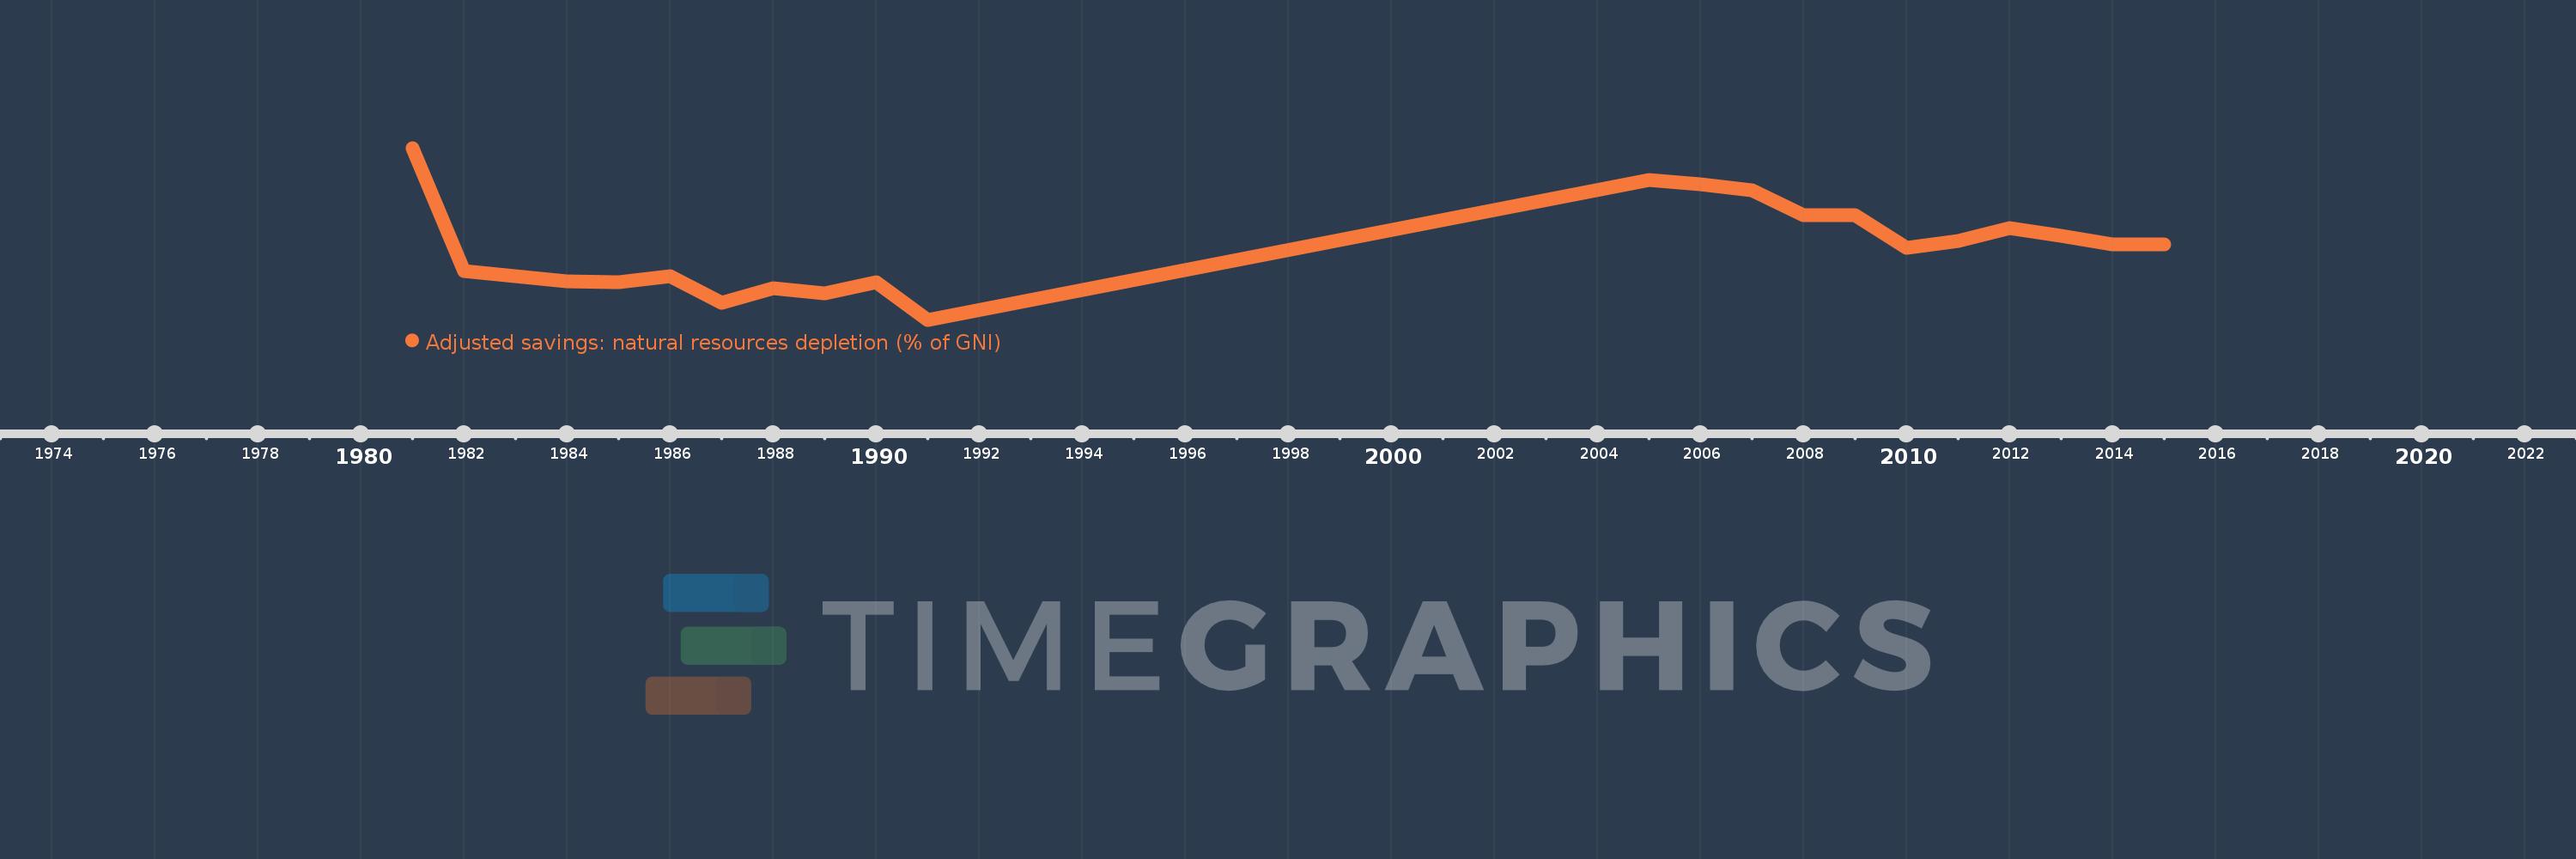
This timeline shows a graph from 1981 to 2015 of Iraq. No data until 1980. Number of actual observations by date: 22.
Source name:
World Development Indicators
Source organization:
World Bank staff estimates based on sources and methods in World Bank's "The Changing Wealth of Nations: Measuring Sustainable Development in the New Millennium" (2011).
Categories, topics:
Economy & Growth, Energy & Mining
Last updated:
apr 23, 2017
Indicators value changes by year
Meaning:
17.865
Minimum:
4.029
jan 1, 1991
Maximum:
36.998
jan 1, 1981
At the date of observation
Value
Absolute change
Change from the previous value
jan 1, 1981
36.998
+36.998
0.0%
jan 1, 1982
13.373
-23.625
-63.85%
jan 1, 1983
12.453
-0.92
-6.88%
jan 1, 1984
11.441
-1.012
-8.13%
jan 1, 1985
11.154
-0.287
-2.51%
jan 1, 1986
12.322
+1.168
10.47%
jan 1, 1987
7.283
-5.04
-40.9%
jan 1, 1988
10.003
+2.721
37.36%
jan 1, 1989
9.154
-0.85
-8.49%
jan 1, 1990
11.158
+2.004
21.89%
jan 1, 1991
4.029
-7.129
-63.89%
jan 1, 2005
30.907
+26.878
667.14%
jan 1, 2006
29.954
-0.954
-3.09%
jan 1, 2007
28.839
-1.114
-3.72%
jan 1, 2008
24.163
-4.676
-16.22%
jan 1, 2009
24.056
-0.106
-0.44%
jan 1, 2010
17.852
-6.205
-25.79%
jan 1, 2011
19.132
+1.281
7.17%
jan 1, 2012
21.621
+2.489
13.01%
jan 1, 2013
20.107
-1.515
-7.0%
jan 1, 2014
18.562
-1.545
-7.68%
jan 1, 2015
18.469
-0.093
-0.5%
Ranking of countries by current statistics by years