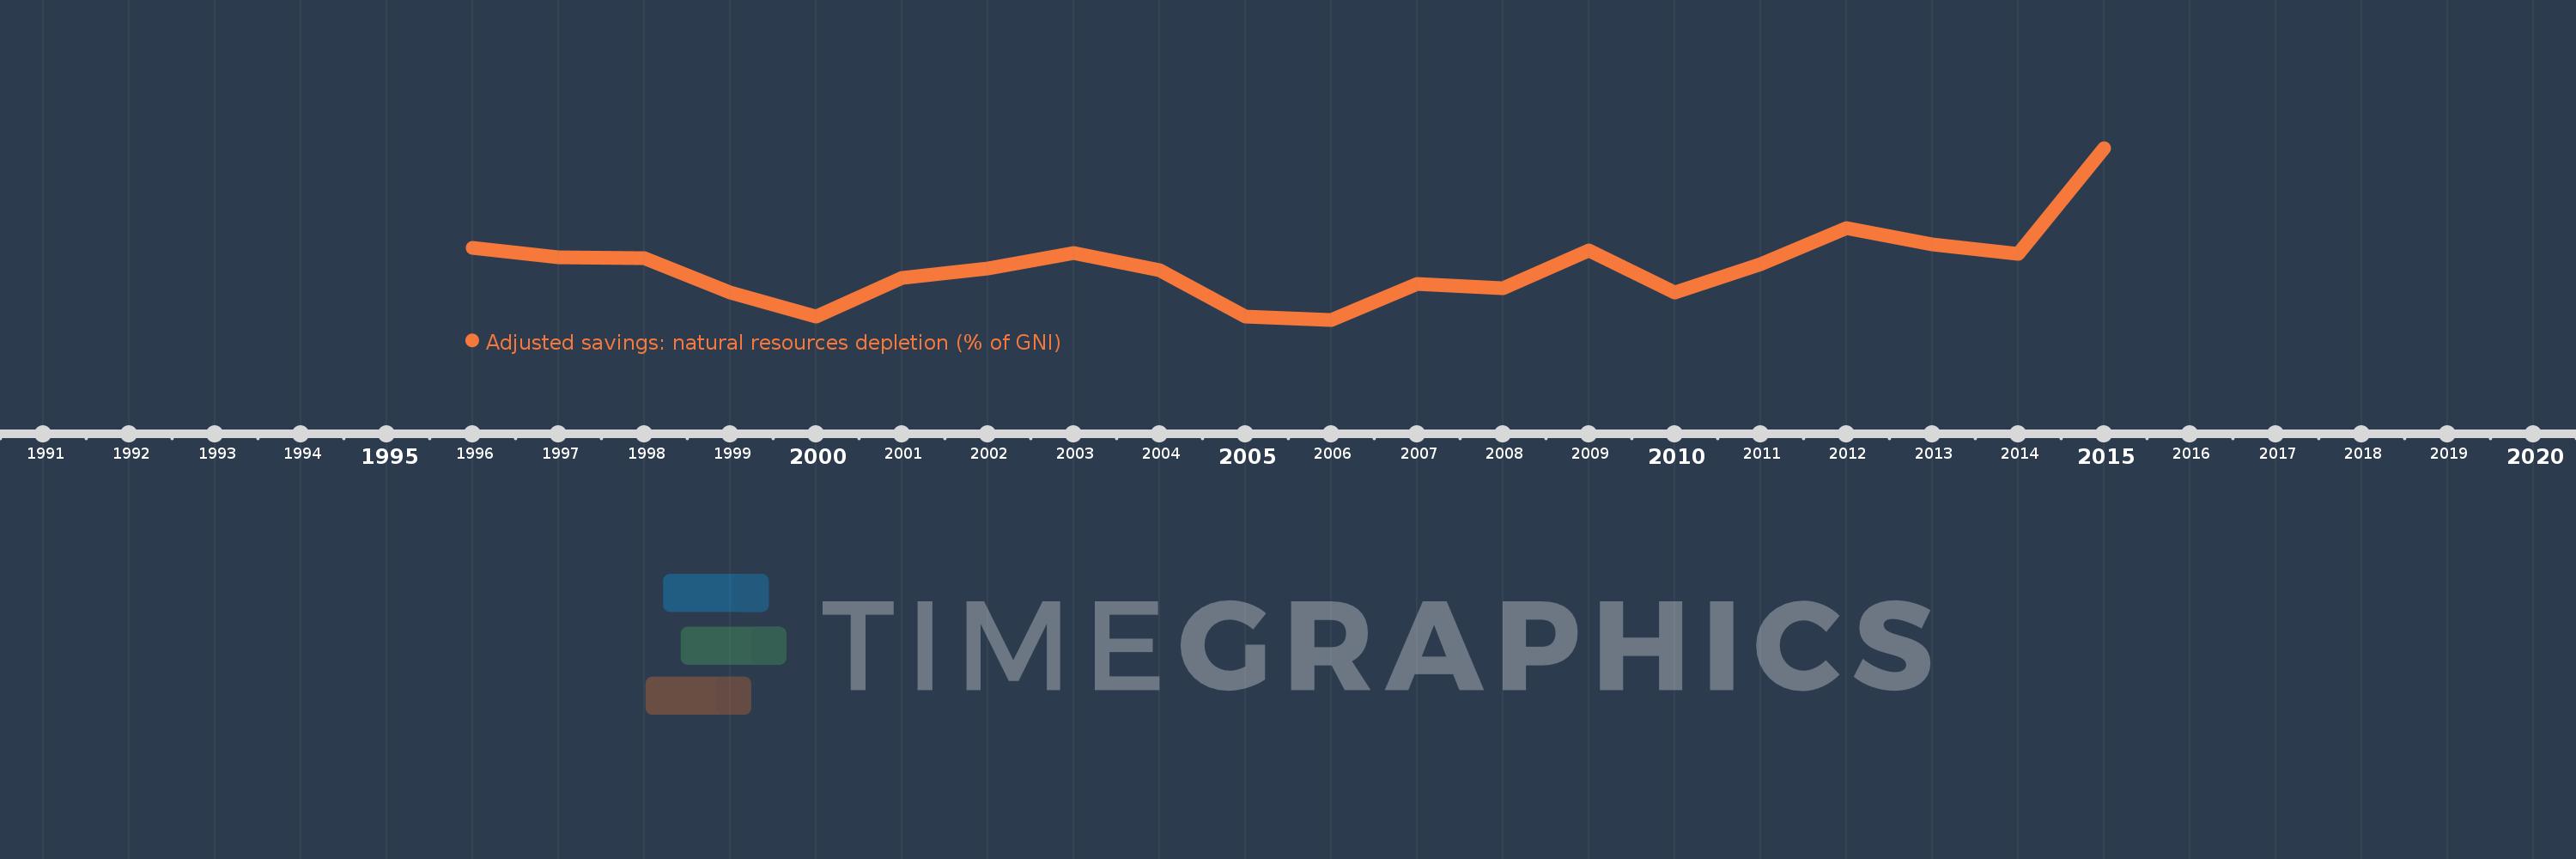
This timeline shows a graph from 1996 to 2015 of Slovenia. No data until 1995. Number of actual observations by date: 20.
Source name:
World Development Indicators
Source organization:
World Bank staff estimates based on sources and methods in World Bank's "The Changing Wealth of Nations: Measuring Sustainable Development in the New Millennium" (2011).
Categories, topics:
Economy & Growth, Energy & Mining
Last updated:
apr 23, 2017
Indicators value changes by year
Meaning:
0.307
Minimum:
0.218
jan 1, 2006
Maximum:
0.504
jan 1, 2015
At the date of observation
Value
Absolute change
Change from the previous value
jan 1, 1996
0.337
+0.337
0.0%
jan 1, 1997
0.322
-0.015
-4.48%
jan 1, 1998
0.32
-0.002
-0.77%
jan 1, 1999
0.264
-0.056
-17.39%
jan 1, 2000
0.223
-0.041
-15.54%
jan 1, 2001
0.287
+0.063
28.4%
jan 1, 2002
0.304
+0.018
6.27%
jan 1, 2003
0.329
+0.025
8.09%
jan 1, 2004
0.301
-0.028
-8.65%
jan 1, 2005
0.224
-0.077
-25.45%
jan 1, 2006
0.218
-0.006
-2.69%
jan 1, 2007
0.278
+0.059
27.25%
jan 1, 2008
0.271
-0.007
-2.54%
jan 1, 2009
0.333
+0.063
23.27%
jan 1, 2010
0.264
-0.069
-20.79%
jan 1, 2011
0.311
+0.047
17.76%
jan 1, 2012
0.37
+0.059
19.03%
jan 1, 2013
0.344
-0.026
-7.15%
jan 1, 2014
0.328
-0.016
-4.66%
jan 1, 2015
0.504
+0.176
53.63%
Ranking of countries by current statistics by years