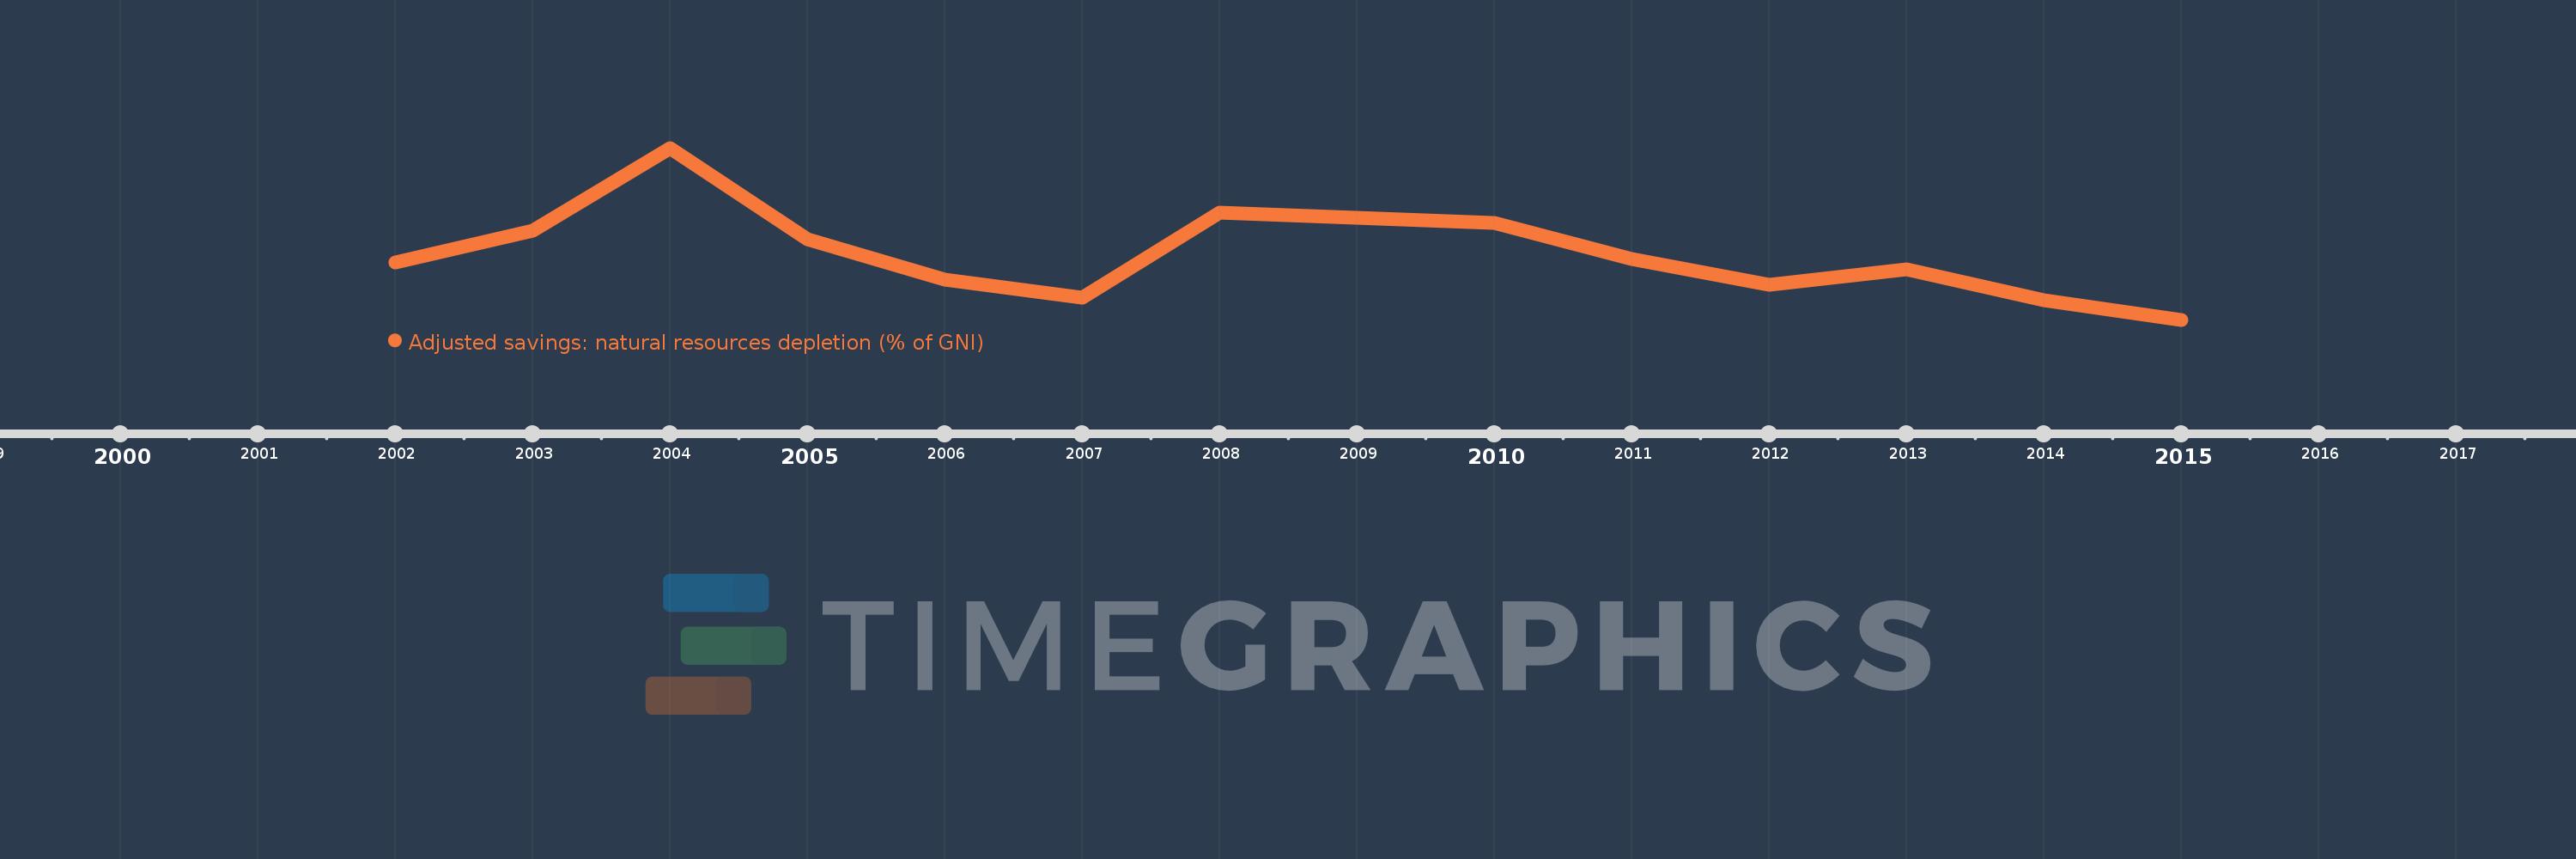
This timeline shows a graph from 2002 to 2015 of Sao Tome and Principe. No data until 2001. Number of actual observations by date: 14.
Source name:
World Development Indicators
Source organization:
World Bank staff estimates based on sources and methods in World Bank's "The Changing Wealth of Nations: Measuring Sustainable Development in the New Millennium" (2011).
Categories, topics:
Economy & Growth, Energy & Mining
Last updated:
apr 23, 2017
Indicators value changes by year
Meaning:
1.996
Minimum:
1.592
jan 1, 2015
Maximum:
2.636
jan 1, 2004
At the date of observation
Value
Absolute change
Change from the previous value
jan 1, 2002
1.939
+1.939
0.0%
jan 1, 2003
2.133
+0.194
10.0%
jan 1, 2004
2.636
+0.503
23.6%
jan 1, 2005
2.08
-0.556
-21.09%
jan 1, 2006
1.837
-0.243
-11.7%
jan 1, 2007
1.726
-0.11
-6.02%
jan 1, 2008
2.244
+0.517
29.97%
jan 1, 2009
2.211
-0.033
-1.45%
jan 1, 2010
2.18
-0.031
-1.41%
jan 1, 2011
1.959
-0.221
-10.13%
jan 1, 2012
1.802
-0.157
-8.01%
jan 1, 2013
1.901
+0.099
5.47%
jan 1, 2014
1.71
-0.19
-10.02%
jan 1, 2015
1.592
-0.118
-6.91%
Ranking of countries by current statistics by years